Chat now with support
Chat with Support

Foglight for Exchange 6.0.0 - User Guide

Navigation basics Exploring the Foglight for Exchange dashboards Managing Exchange agents Reporting on your Exchange environment Foglight for Exchange views
Role views Exchange Server views Site views Cluster views Description of Embedded views
Agent State view Alarms view Auto Attendant Calls view Auto Attendant Directory Access view Auto Attendant General view Auto Attendant Transfers view Cached LDAP Searches/sec view CAS AB Load view CAS AB Service view CAS Control Panel Load view CAS Load view CAS OAB Download view CAS RPC Client Access view CAS RPC Client Access Load view CAS RPC HTTP view Client Access Features view Cluster Database Details view Cluster Storage Group Details view Cluster Summary and Resource Information view Cluster Summary view Clusters Listing view CPU view Disk view Domain Controllers view Edge Agent view Edge Transport Features view Exchange Roles Server Summary view Exchange Server Roles view (reference information) Exchange Servers in This Cluster view Exchange Servers view (Exchange Cluster Environment Summary) Exchange Servers view Host Monitor view Hub Transport Features view IP Address view Mailbox Features view Mailbox Store Assistant view Managed Availability Recovery Action Results view Memory view Network view Processes LDAP Read Time view Resource Utilization view Roles Listing view Roles Explorer view Role Features State view Roles Top 3 view Server Health view Server Listing view Servers in Site view Servers In This Site view Site By Category view Site Listing view Store Calendar Attendant view Store Client Search view Store Content Indexing view Store Database view Store Public Load view Store Resource Booking view Store RPC Client Throttling view Store Transport view Store User Load view Summary and Resource Information view Top 3 CPU Consumers view Top 3 Memory Consumers view Top 3 Network Consumers view Top 3 Storage Consumers view Total LDAP Read Time On All DCs view Total Long-Running LDAP Operations On All DCs view Transport Dumpster view Transport Edge Sync view Transport Extensibility Agent view Transport Load Store Drivers view Transport Queues view UM Availability view UM Call Answer General view UM Call Answer view UM Fax view UM General Current view UM General view UM Subscriber Access Calendar view UM Subscriber Access Directory view UM Subscriber Access General view UM Subscriber Access Message view Unified Messaging Features view Windows Services view
Foglight for Exchange rules Running diagnostic tests Managing Exchange metrics

Accessing the Foglight for Exchange dashboards

Click Exchange Alarms to display a list of the current alarms triggered within Foglight for Exchange.
Click Exchange Environment to display the Exchange Environment dashboard, which includes the following tabs:
Monitoring: displays a summary of the Exchange servers being monitored and their current state.
Health Check: displays the health state of clusters and servers in your environment.
Administration: allows you to perform administrative tasks, including:
Reports: allows you to build, view, and manage custom reports.
FAQts: displays questions relating to a selected object.
Click Exchange Explorer to display performance metrics and alarms for an Exchange server or group of servers.
Click Rule Management to view and manage Foglight for Exchange rules.

Exchange Alarms dashboard

The Exchange Alarms dashboard shows the alarms that have been triggered but not cleared within Foglight for Exchange. It can be used to isolate alarms specific to your Exchange environment.

The Alarms List on this view is a sortable list that displays the outstanding Foglight for Exchange alarms. Each alarm row in the Alarms List contains the following information.

Severity

The icon in this column indicates the severity of the alarm.

Server

Displays the name of the Exchange server where the alarm occurred. Clicking the server name displays a popup menu where you can choose to view details about the selected server in either the Exchange Explorer dashboard or Quick View in the Exchange Environment dashboard.

Time

Displays the date and time when the alarm occurred.

Cleared

Displays whether the alarm was cleared.

Cleared by

For cleared alarms, displays the users who cleared the alarm.

Instance

Displays the topology object instance name that triggered the alarm.

Alarm Message

Displays the alarm message.

Clicking an alarm’s severity icon, object icon, alarm message, or time displays a popup where you can acknowledge or clear the alarm. This popup provides pertinent information about the selected alarm, such as the rule of origin of the alarm, the history of the alarm, and all of the notes attached to the alarm. For more information about managing alarms, see the Foglight User Guide or online help.

Exchange Environment dashboard

The Exchange Environment dashboard includes the following tabs:

Monitoring: displays the health state of clusters and servers in your environment. For details, see Exchange Environment > Monitoring tab.
Health Check: displays clusters and servers health state. For details, see Exchange Environment > Health Check tab.
Administration: allows you to perform administrative tasks, including:
Reports: allows you to manage custom Exchange reports. For details, see Exchange Environment > Reports tab.
FAQts: displays questions relating to a selected object. For details, see Exchange Environment > FAQts tab.

Exchange Environment > Health Check tab

The Health Check tab displays the health state of clusters and servers in your environment. This tab consists of the following views:

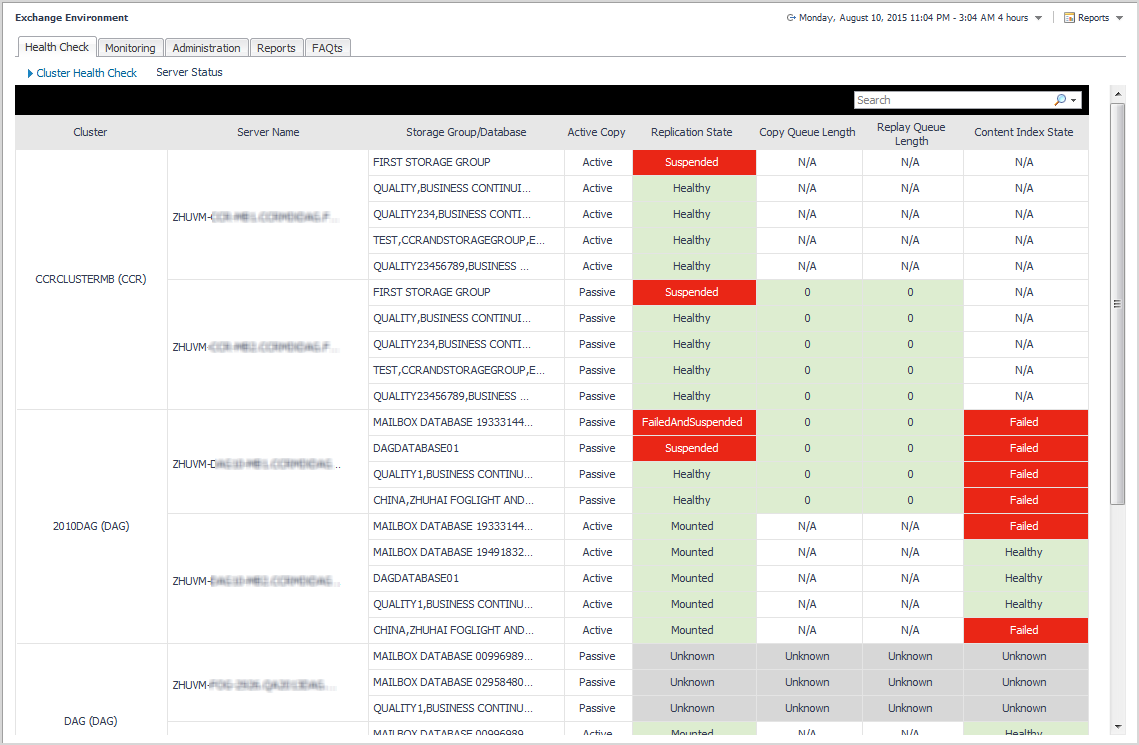
Click the Cluster Health Check link at the top of the tab, to display the Cluster Health Check view.

The following table lists the information displayed in the report.

Cluster

Cluster name.

Server Name

Name of the Exchange servers included in the cluster.

Storage Group/Database

Exchange cluster storage group or database name.

Active Copy

Cluster copy state (active or passive).

Replication State

Health state for cluster replication state.

Copy Queue Length

Health state for cluster copy queue length on a passive node.

Replay Queue Length

Health state for cluster replay queue length on a passive node.

Content Index State

Health state for cluster content index state.

To search for a particular cluster, type the cluster name on the Search box at the top right corner of the view, then press Enter.

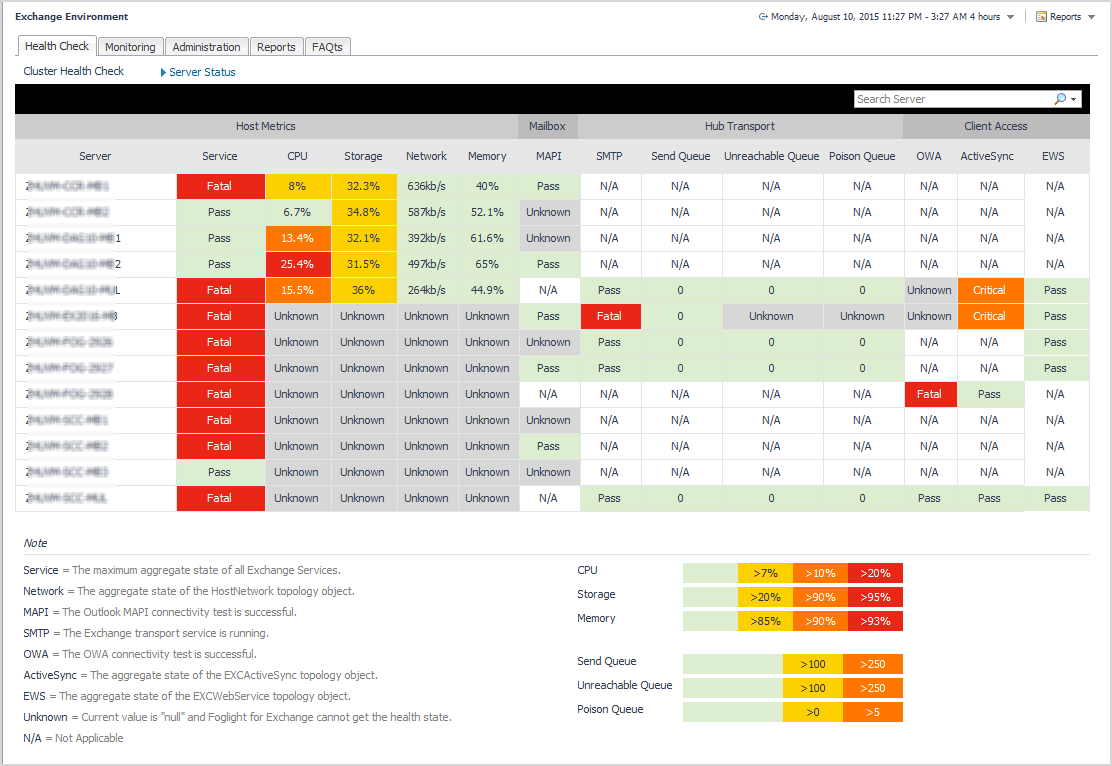
Click the Server Status link at the top of the tab, to display the Server Status view.

The following table lists the information displayed in the report.

Host Metrics

Server

Server name.

Service

Indicates if Exchange services are running.

CPU

Health state for the host CPU.

Storage

Health state for the host storage.

Network

Health state for the host network.

Memory

Health state for the host memory.

Mailbox

MAPI

Health state for the Outlook MAPI feature.

Hub Transport

SMTP

Health state for the SMTP feature.

Send Queue

Health state for the hub transport send queue.

Unreachable Queue

Health state for the hub transport unreachable queue.

Poison Queue

Health state for the hub transport poison queue.

Client Access

OWA

Health state for the OWA feature.

ActiveSync

Health state for ActiveSync.

EWS

Health state for the Exchange Web Service.

To search for a particular server, type the server name on the Search Server box at the top right corner of the view, then press Enter.

Related Documents

The document was helpful.

Select Rating

I easily found the information I needed.

Select Rating