To access this dashboard, from the navigation panel, under Dashboards, choose VMware > vmAlarms. For reference information about the data appearing on this dashboard, see VMware Alarms views .
The vmAlarms dashboard provides some filtering controls. Use it to isolate alarms related to a specific bottleneck or issue in your virtual environment. The Search box appears in the top-right corner of the alarm list.
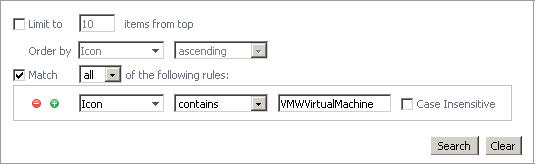
For more advanced filtering, click the down-facing arrow, and in the list that appears, click Advanced Search. A dwell appears.
To search on a Foglight for VMware object name, select Match all of the following rules, and in the Icon box below, type a full or partial name of the object you want to search for, and then click Search. The Alarms List refreshes, showing only those alarms that are generated against the specified object type. For a list of icons and the related object names, see Virtual Infrastructure View Object Icons .
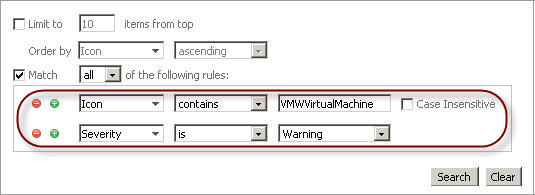
If you want to search on an alarm severity or rule name, or to combine different search criteria, update or add one or more rules in the Match all of the following rules area. For example, to search for alarms generated against a specific object type and have a specific severity, create one rule to specify the object type, and one for the rule severity.
For more information on filtering lists in Foglight for VMware, refer to the Foglight for VMware User Guide.
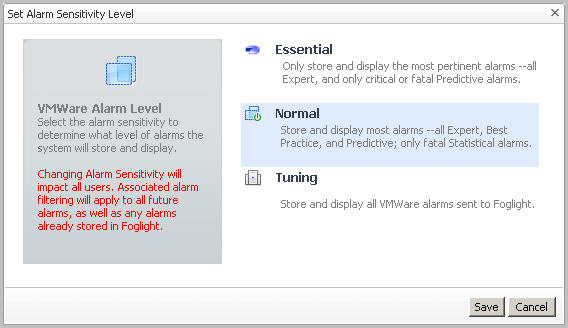
The Administration tab on the VMware Environment dashboard enables you to configure the level of alarm sensitivity. The Foglight® for VMware alarm sensitivity reflects the level of alarms the system stores and displays.
|
1 |
On the VMware Environment dashboard, open the Administration tab and click Set Alarm Sensitivity Level. |
|
3 |
Click Save. |
A VMware® environment typically includes one or more Virtual Centers. A Virtual Center includes a collection of datacenters, clusters, ESX® hosts, resource pools, and virtual machines. Data centers are typically used to define physical boundaries within which ESX hosts exist, while resource pools enable an administrator to fine-tune resource allocations within a cluster. A cluster can have one or more ESX hosts associated with it, and one or more virtual machines can run on each ESX hosts. Each virtual machine is allocated a portion of the ESX host’s resources, including disk, CPU, memory, and network resources. A virtual machine has its own machine name and IP address, and it runs a guest OS (for example, MS Windows XP), along with other applications.
These actions require that you set up credentials for the virtual center on the Automation Configuration dashboard. To do that, on the navigation panel, under Dashboards, choose VMware > Automation Configuration. On the Automation Configuration dashboard that appears, in the Virtual Infrastructure view, select a virtual center, click Assign Credential, and provide host credentials in the Assign Host Credentials Dialog box. Failing to configure host credentials results prevents the automated tasks from being executed.
|
3 |

|
4 |
On the navigation panel, under Virtual Infrastructure, on the Topology tab, select an ESX host or virtual machine object instance in the navigation tree. |
|
5 |
In the VMware Explorer, open the Administration tab. |
|
TIP: Use the Topology tab to quickly switch between object instances and display their details in the VMware Explorer. For more information about this view, see Virtual Infrastructure view . |