|
3 |
|
4 |
On the VMware Environment dashboard that appears in the display area, open the Administration tab. |
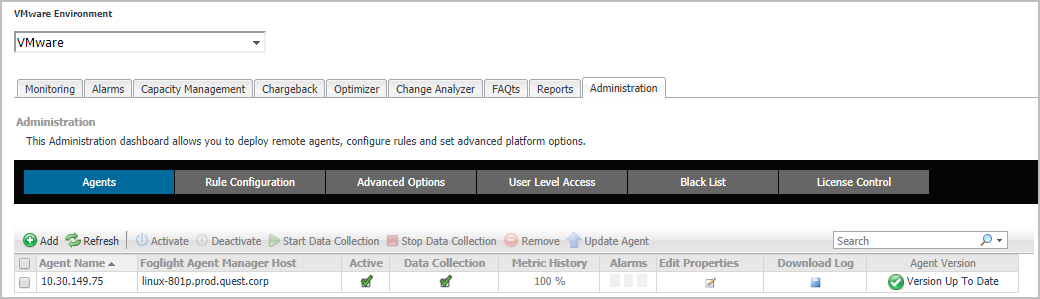
Foglight® for VMware uses the VMware Performance Agent to collect information from monitored environments. Creating a VMware Performance Agent instance creates the agent process on the Agent Manager host. Activating the VMware Performance Agent starts that agent process while starting an agent instance’s data collection enables the agent to start collecting data from the monitored vCenter® and to send it to Foglight for VMware.
When the VMware Performance Agent package is successfully deployed, create one or more agent instances, activate them, and start their data collection. To perform these steps in a single operation for one or more monitored hosts, use the Agents view on the Administration tab.
Each VMware Performance Agent monitors a single Virtual Center. When you create a VMware Performance Agent instance and the Agent Setup wizard determines that the Virtual Center was not previously monitored by this Foglight instance, it starts importing historical data into Foglight. This data is not immediately available as it takes some time to collect it. This process can import data collected over 30 days or less, depending on the amount of data available in the Virtual Center. This allows you to explore VMware metrics as soon as the data is imported, instead for waiting for the agent to collect some data from the Virtual Center. The Metric History column in the Agents table indicates the progress of the historical data import. Historical data is intended for charting, trending, and general presentation purposes. It does not cause any alarms to fire.
|
2 |
On the navigation panel, under Dashboards, choose VMware > VMware EnvironmentOn the VMware Environment dashboard that appears in the display area, open the Administration tab. |
|
3 |
|
a |
In the Virtual Center box, type the fully qualified name of the host on which the Virtual Center is running. |
|
b |
In the Port box, type the port number of the host running the Virtual Center that will be used by the VMware Performance Agent to connect to the Virtual Center. |
|
c |
If you want to enable the VMware Performance Agent to collect the Foglight Storage data, select the Enable Storage Collection check box. Foglight Storage can help you optimize the VMware environment by monitoring virtual storage and its underlying physical storage components. For more information about this product, see the Managing Foglight Manager Storage User and Reference Guide. |
|
d |
If you want to import historical data, select the Enable Historical Metric Data check box. This data is not immediately available as it takes some time to collect it. This process can import data collected over 30 days or less, depending on the amount of data available in the Virtual Center. Selecting this option allows you to explore VMware metrics as soon as the data is imported, instead for waiting for the agent to collect some data from the Virtual Center. |
|
e |
Click Next. |
|
• |
Add vCenter(s) to a new credential: Select this option if you want to create a new credential for the selected vCenter. Click Next and continue to Step 7. |
|
• |
Add vCenter(s) to an existing credential: Select this option if you want to use an existing credential for the selected vCenter. This option is suitable if an existing credential has the information needed to access the vCenter. Click Next and continue to Step 8. |
|
• |
Credential Name: Type a name that uniquely identifies the credential. |
|
• |
User: Type the vCenter user name. |
|
• |
Password: Type the vCenter password. |
|
• |
Confirm Password: Type the vCenter password. |
|
c |
Click Next. |
|
d |
Click Finish. |

|
b |
Click Next. |
|
c |
Click Finish. |
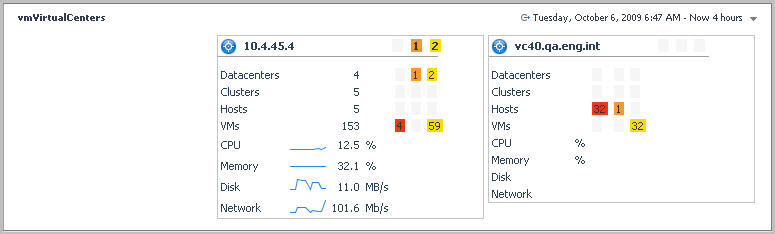
To access this dashboard, from the navigation panel, under Dashboards, choose VMware > VMware VirtualCenters.
For reference information about the data appearing on this dashboard, see VMware VirtualCenter views .
A typical virtual environment contains a set of ESX® host and virtual machines. An ESX host can be a part of a cluster, and can have one or more virtual machines associated with it. Other components of a Virtual Center include datacenters, resource pools, and data stores. You can view the overall state of these components on the VMware Environment dashboard.
When you navigate to the VMware Environment dashboard for the first time, the Monitoring tab appears open. This tab provides an overall summary of your virtual environment. Other tabs are also available. This topic describes the Monitoring tab. For information about other tabs, see the following topics:
|
• |
|
• |
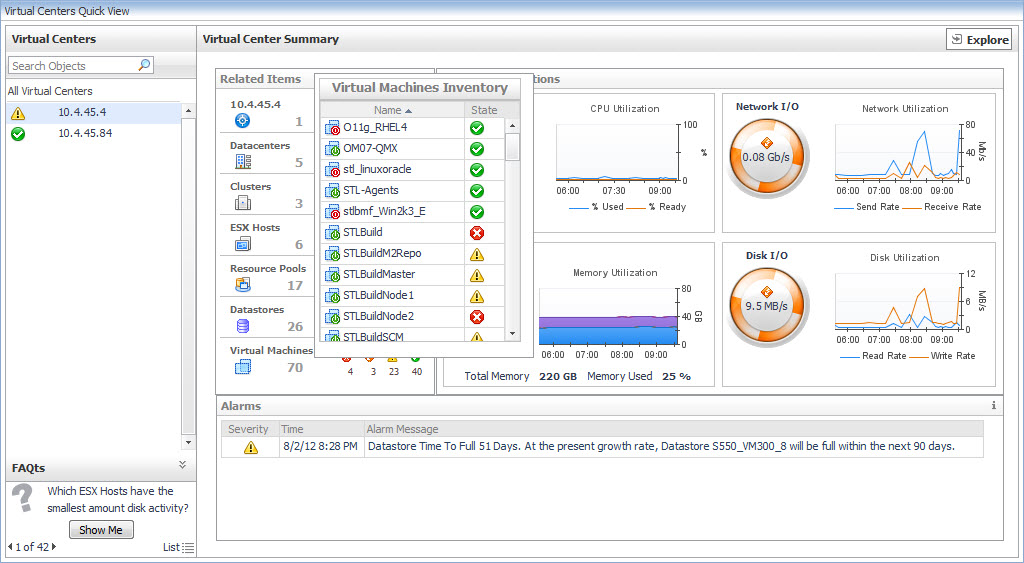
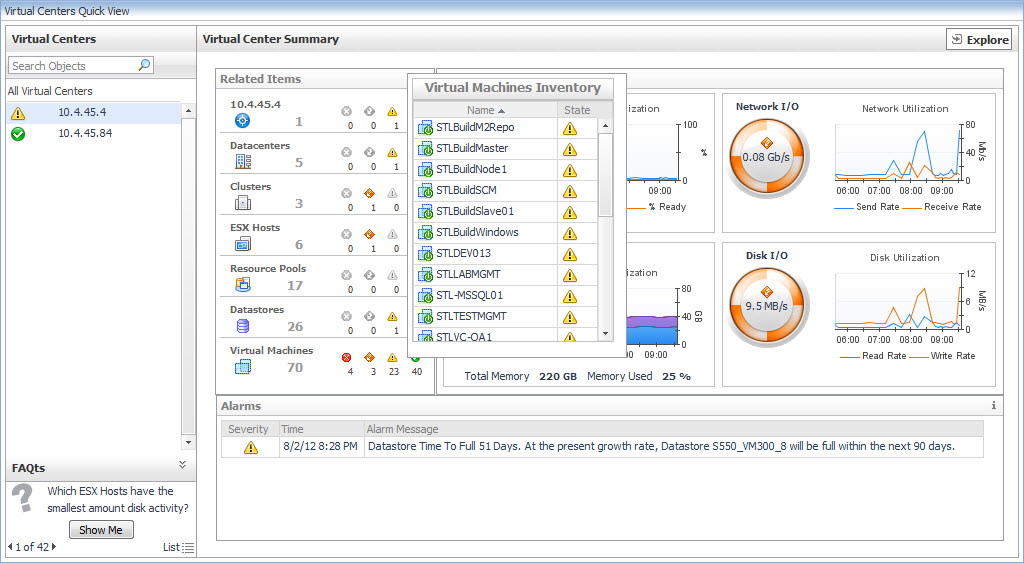
The VMware Environment dashboard is made up of the following views: the Virtual Environment Overview and Quick-View. Selecting an object type and its alarm state in the Virtual Environment Overview shows the summary information for your selection in the Quick-View. For reference information about the data appearing on this dashboard, see VMware Environment views .
In the example below, the ESX Hosts tile is selected. The ESX Hosts view is populated with all monitored ESX Hosts regardless of their alarm state. Summary information for those ESX Hosts appears in the ESX Host Summary view.