Chat now with support
Chat with Support

Foglight for SQL Server (Cartridge) 5.9.4.10 - User Guide

Introduction to this Guide Using Foglight for SQL Server
Viewing the Databases Dashboard Overview Dashboard Advisories Dashboard Monitoring Data Replication Monitoring SQL Performance Reviewing Memory Usage Reviewing the Instance Activity Reviewing Database Usage Reviewing the Services Using the HADR Drilldown Using the Logs Drilldown Reviewing Configuration Settings Viewing User-defined Performance Counters and Collections
Monitoring Business Intelligence Services Administering Foglight for SQL Server
Configuration Settings Managing Foglight for SQL Server Agent Settings Reviewing Foglight for SQL Server Alarms Generating Reports Monitoring SQL Server instances on VMware servers
Glossary
A
Access methods Adhoc SQL Plans Alarm Alert Allow updates Anonymous subscription Authentication AutoClose AutoGrow Automatic Discovery AutoShrink B Batch BCP (Bulk Copy Program) Blocking Books Online Bound trees Buffer Buffer cache Buffer pool Bulk copy Bulkinsert Bulk load C Cache CAL Calibration Cardinality Cartridge Chart Checkpoint process Client network utility CLR Compile Connect Connection Connectivity software CPU Usage Cursors D Data access components Data file Data storage engine Database Database object DataFlow DBCC DBID DBO Deadlock Disk queue length Disk transfer time Disk utilization DiskPerf Distributing instance Distributor DMO Drilldown DTC DTS E Error log Event alert Execution contexts Extended stored procedures Extent External procedures F File Filegroup File cache Foglight Agent Manager Foglight Management Server Foreign key Forwarded records Free buffers Free list Free pages Free potential Free space Freespace scans Full text search G GAM Ghosted records Growth increment GUID H Hash buckets Hashing Heap Hit rate Hit ratio Host name Host process I I/O Index Indid Integrated security Intent Locks J Job K Kernel memory Kernel mode Kill L Latch Lazy writer Licensing Lightweight pooling Lock Lock area Lock escalation Lock mode Log Log cache Log writer Logical I/O LRU LSN M Master MaxSize MDAC Metric Misc.normalized trees Model Monitor page file N Named pipes Net library NIC Null O OBID Object plans OLAP OLAP service OLTP Optimizer Optimizer cache osql P Page life expectancy Paging Panel Parse Parser Per seat licensing Per server licensing Performance alert Physical I/O Physical read Physical write PID Pinned Plan Plan cache Potential growth Prepared SQL plans Primary key Privileged mode Procedure cache Procedure plans Process Profiler Publication database Publisher Publisher databases Publishing server Pull subscription Pulse Push subscription Q Query plan R RAID Random I/O Read ahead Recompile Referential integrity Relational data engine Replication procedure plans Role Rollback S sa Schema locks Sequential I/O Session Severity SGAM Shared locks Show advanced options SMP Sort, Hash, Index Area SPID Spike Spinner SQL Agent Mail SQL Mail SQL Plans SQL Server Agent SQL Server authentication SQL Server books online Standard deviation Stolen pages Stored procedure Support service SYSADMIN role T TDS TempDB Temporary tables and table variables Threshold Torn page detection Transaction Trigger Trigger plans Truncate Trusted U UMS Unused space User connection area User mode V Virtual log file VLF W Waitfor Windows authentication mode Working set
Reference
SQL PI Repository Cold Backup Procedure SQL Performance Investigator Metrics
Active Time All SQL Agents CPU Usage All SQL Agents Resident Memory Usage Availability Average Physical I/O Operations Average SQL Response Time Backup Recovery Wait Blocked Lock Requests Checkpoint Pages CLR Wait CPU Usage CPU Wait Cursor Synchronization Wait Database Replication Wait Deferred Task Worker Wait Degree of Parallelism Disk Utilization DTC CPU Usage DTC Resident Memory Usage Distributed Transaction Wait Executions Ended Executions Started External Procedures Wait Full Scans Full Text Search CPU Usage Full Text Search Resident Memory Usage Full Text Search Wait Free Buffer Wait Hosted Components Wait IO Bulk Load Wait IO Completion Wait IO Data Page Wait IO Wait Latch Buffer Wait Latch Wait Latch Savepoint Wait Lazy Writes Lock Wait Lock Bulk Update Wait Lock Exclusive Wait Lock Intent Wait Lock Requests Lock Schema Wait Lock Shared Wait Lock Update Wait Lock Wait Log Buffer Wait Log Flushes Log Other Wait Log Synchronization Wait Log Wait Log Write Wait Memory Wait Network IO Wait Network IPC Wait Network Mirror Wait Network Wait Non SQL Server CPU Usage Non SQL Resident Memory Usage OLAP CPU Usage OLAP Resident Memory Usage OLEDB Provider Full Text Wait Other CPU Usage Other Miscellaneous Wait Other Wait Overall CPU Page Life Expectancy Page Splits Parallel Coordination Wait Physical I/O Physical Memory Used Physical Page Reads Physical Page Writes Probe Scans Plan Cache Hit Rate Range Scans Rec Ended Duration Remote Provider Wait Run Queue Length Samples Service Broker Wait Session Logons Session Logoffs SQL Agent CPU Usage SQL Agent Resident Memory Usage SQL Executions SQL Mail CPU Usage SQL Mail Resident Memory Usage SQL Recompilations SQL Response Time SQL Server Background CPU Usage SQL Server Cache Memory SQL Server Connections Memory SQL Server Connections Summary SQL Server Foreground CPU Usage SQL Server Resident Memory Usage SQL Server Swap Memory Usage Synchronous Task Wait Table Lock Escalation Target Instance Memory Total CPU Usage Total Instance Memory Virtual Memory Used
Rules Collections and Metrics

Mirroring Table

The Mirroring table displays the columns listed below.

The table below provides data about the columns that appear by default in the table. For a list of additional metrics, which are hidden by default, see Additional metrics in the Mirroring table .

A number (ID) uniquely identifying a database within a SQL Server.

The database name.

The role the database takes in the mirroring process; either principal or mirror.

The name of the instance whose role in the process is principal.

The name of the instance whose role in the mirroring process is mirror.

Indicates the severity determined based on the database state: Normal, Warning, or Critical. Each of these severity level values can correspond to several mirroring states.

Normal — can correspond to one of the following mirroring states:

Warning — can correspond to one of the following mirroring states:

Critical — can correspond to one of the following mirroring states:

A state indicating the mirroring session condition. This field can have one of the following values:

The safety level at which the mirroring session is configured to work. This column indicates the level of synchronization between the two servers that take part in the mirroring process.

This field can have one of the following values:

The redo queue size. This size can be either left Unlimited or defined in megabytes (MB).

The number of warning, critical, and fatal alarms for the SQL Server database instance. When holding the cursor over one of the alarm counts, the dwell displays the most recent alarms raised against this database, sorted by severity.

Clicking this field displays the Alarms list, which is listed by severity order. See the Foglight Online Help, Monitoring System-Wide Alarms for details on the alarm information.

The metrics listed below, which are also part of the Database Mirroring collection, do not appear by default in the Mirroring table. For details on these metrics, see the Database Mirroring Collection section in Foglight for SQL Server Reference Guide.

1
Click the Customizer button () at the end of the table.

Viewing the Role and Data Flow of the Selected Database

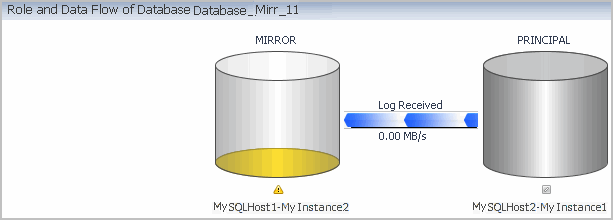
The Role and Data Flow of Database section displays the mirroring operation of the database selected in the Mirroring table and its mirroring partner. The monitored instance is always displayed on the left, and the data is shown as flowing in this instance’s direction, that is: Log Received if the database is Mirror, and Log Sent if the database is Principal.

To investigate the data flow by displaying the selected database’s mirroring partner, use one of the following methods:

Click the link Investigate using the Partner’s Mirroring Page on the upper right side of the panel, above the table.

If the partner is currently monitored, its mirroring page will now be displayed. For details, see Viewing the Partner’s Mirroring Page . Otherwise, an error message is displayed, notifying that the partner server is currently not monitored.

Viewing the Selected Database's Mirroring Performance History

Clicking the Mirroring Role column of the Mirroring table displays the database’s Mirroring Performance History page, which allows carrying out the tasks described in the following sections:

The Mirroring Role pane displays the role the database played in the mirroring operation during the selected time range: Principal, Mirror, or Not Mirroring.

The mirroring role is displayed as a gauge, with each of the mirroring roles indicated by another color. Positioning the cursor over the gauge displays the percentage, within the specified time range, the database spent in each role.

The middle section of the Mirroring Performance History page includes the following panes:

Principal Counters — this pane displays a chart of the following values, which can be selected from the list on the upper left:
Mirror Counters — this pane displays a chart of the following values, which can be selected from the list on the upper left:

The Mirroring Roundtrip section displays a chart that indicates the latency of the mirroring session during the selected time range.

Viewing the Partner's Mirroring Page

When viewing the mirroring performance of a database that takes part in the mirroring operation, either as a principal or as a mirror database, it is possible to investigate the selected database’s mirroring partner, using one of the following methods:

Clicking the link Investigate using the Partner’s Mirroring Page on the upper right side of the table.

In so doing, the mirroring operation can be investigated from the point of view of the other database, thereby determining the source of the performance issue.

Related Documents

The document was helpful.

Select Rating

I easily found the information I needed.

Select Rating