Net Monitor Environment view
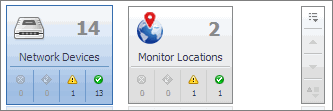
The Net Monitor Environment view displays a high-level overview of your monitored environment. The view has two tiles, each representing the monitored objects of interest: Network Devices and Monitor Locations.

Each tile shows how many of the corresponding object instances there are in your monitored infrastructure, as well as the count of objects of that type in each of the alarm states Normal  , Warning
  , Critical
  , or Fatal
  ). For example, the following image shows 14 network devices: none in the Fatal or Critical states, one in Warning, and 13 in the Normal state.
You can move the tiles by dragging and dropping until you achieve the desired layout. To hide one or more tiles, on the tool bar on the right, click  , and in the popup that appears, click a tile that you want to hide.

Clicking the object type icon, the object type name, or the object count, shows summary information for that object type in the Quick View. Clicking an alarm state (for example, Warning) on a tile displays summary information in the Quick View for the objects of that type that are in the selected alarm state. If an alarm state has a count of zero, then you can not drill down on the alarm state.
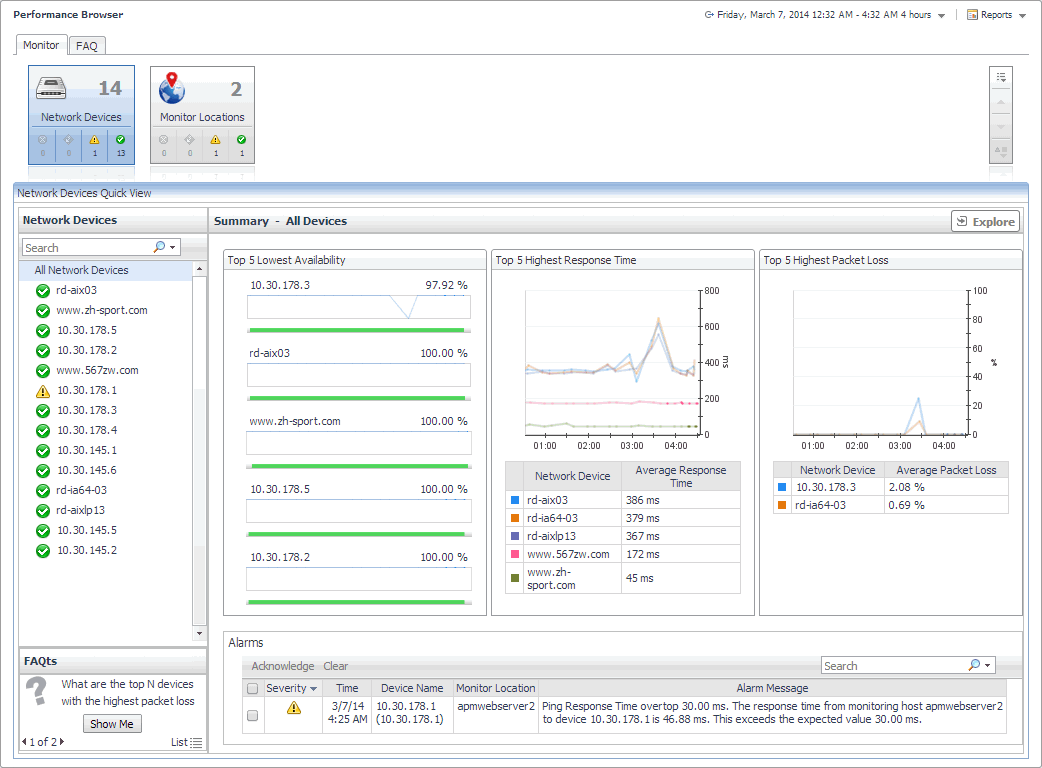
This view appears in the upper part of the Performance Browser, just above the Quick View.
This view is made up of the following embedded views:
Network Devices view
The Network Devices view lists the monitored network devices and shows their alarm states.
If a device name override is specified, this name appears in the list. If a device belongs to a private network, the private network ID is appended to the device.
Selecting All Network Devices shows the overall response and availability information for the monitored devices in the Summary - All Devices view on the right. Similarly, selecting a device in the list shows device-specific metrics in the Summary - Single Device Summary view view on the right.
|
|
|
• |
Alarm severity. The state of the most recent alarm raised against the associated network device: Warning  , Critical  , or Fatal  . |
|
• |
All Network Devices. A parent node for the network device object instances that appear in this view. |
|
|
|
Drill down on:
|
Monitor tab
The Monitor tab is a container view. This tab displays a combination of location- or device-related information, depending on your selection in the Net Monitor Environment view and the Quick View. Use it to gain an understanding of how well your monitored network devices are performing, and to investigate any potential issues.

The Monitor tab appears open.
This view is made up of the following views:
Monitor Locations view
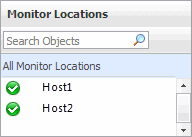
The Monitor Locations view lists the hosts that are running instances of the Net Monitor Agent, and shows their states.

Selecting All Monitor Locations shows a list of all host names in the Summary - All Monitor Locations view on the right. Similarly, selecting a location in the list shows location-specific metrics in the Single Location Summary view view on the right.
The Monitor Locations view appears in the
Quick View on the left.
|
|
|
• |
Alarm severity. The state of the most recent alarm raised against the associated location: Warning  , Critical  , or Fatal  . |
|
• |
Location. The name of the host on which the Net Monitor Agent is running. | |
|
|
Drill down on:
|

