サポートと今すぐチャット
サポートとのチャット

Foglight for Infrastructure 5.9.2 - Infrastructure Utilities User Guide

Monitoring Web transactions Monitoring network devices

Net Monitor Devices Management views

The Devices Management dashboard contains the following views:

Agent Alarms view

The Agent Alarms view displays the alarms generated against the existing agents.

On the Devices Management dashboard, this view appears just below the Devices Management table.

Lists the alarms generated against the monitored locations.

NOTE: To acknowledge or clear one or more alarms appearing in this table, select them and click Acknowledge or Clear, as required. For more information about alarms in Foglight, see the Foglight User Guide.
Ack’ed. Indicates if the alarm is acknowledged: true or false.
Device Name. The name of the device against which the alarm is generated, as configured on the Devices Management dashboard. For more information, see Managing monitored network devices.
Severity. Indicates the alarm severity: Warning , Critical , or Fatal .
Time. The date and time when the alarm is generated.
Alarm Message. The alarm message.

Drill down on:

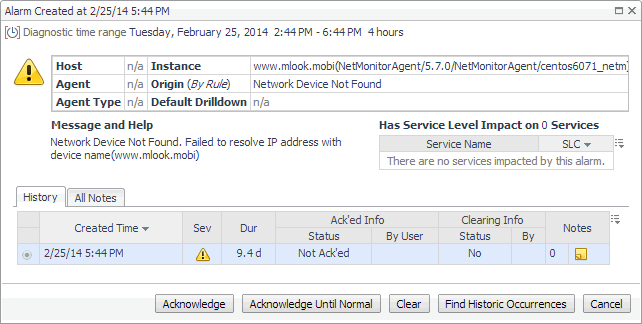
Any row. Displays the Alarm Created dialog box, showing additional information about the alarm. For more information about alarms in Foglight, see the Foglight User Help.

Devices Management table

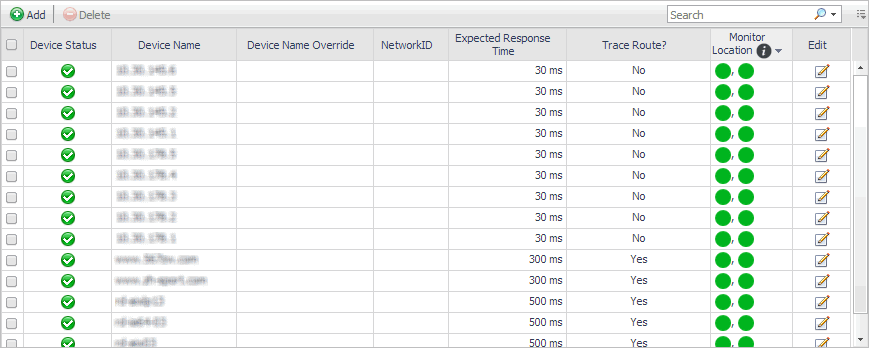
The Devices Management view displays the monitored network devices.

On the Devices Management dashboard, this view appears just above the Agent Alarms view.

Device Name Override. The device name override, if one is specified.
Device Name. The name of the monitored device.
Device Status. The state of the highest severity alarm raised against the network device: Warning , Critical , or Fatal .
Expected Response Time. The expected round-trip response time between the host on which the Net Monitor Agent is installed and the network device.
Monitor Location. A color-coded indicator of the data collection state for each location from which this network device is monitored. Green indicates Normal, yellow Warning, orange Critical, and red the Fatal state.
NetworkID. The ID of the private network to which the network device belongs, if applicable.
Trace Route?. Indicates if the route from the monitoring agent to the network device is traced.

Net Monitor Performance Browser views

The Performance Browser contains the following views:

関連ドキュメント

The document was helpful.

評価を選択

I easily found the information I needed.

評価を選択