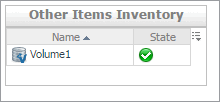
The Volume Summary view shows the levels of resource utilization and consumption for a selected volume.
The Volume view shows the data transfer rates and latency detected for the selected volume. It also identifies the virtual machines that use the highest amounts of the volume resources.The information provided on this tab can help you prevent potential bottlenecks by reallocating disk resources where they are most needed.
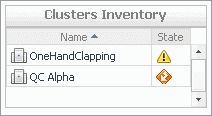
The Virtual Switches tree view lists the available volumes and indicates their severity state.
This view appears in the Quick-View on the left when you select the
Virtual Switches tile in the
Virtual Environment view.
Selecting the All Virtual Switches node displays the overall resource utilization for all virtual switches in your integrated system and identifies the ones that consume the highest amount of network resources in the
Summary - All Virtual Switches view on the right. Similarly, selecting a virtual switch node shows switch-specific metrics in the
Summary - Virtual Switch view.