サポートと今すぐチャット
サポートとのチャット

Foglight for VMware 7.3.0 - User Guide

Using Foglight for VMware
Introducing the virtual infrastructure Navigation basics Interacting with Foglight for VMware VMware Performance Agent configuration
Reference
Views
VMware Alarms views VMware Explorer views VMware Modeler views VMware VirtualCenter views VMware Environment views Other views
Rules
Agent Rules Cluster Rules Datacenter Rules Datastore Rules Resource Pool Rules ESX Server Rules VirtualCenter Rules Virtual Machine Rules VMW Stale Data Management Rule Virtual Switch Rules
Appendix: Alarm Messages Appendix: Metrics

Alarms List view

Each alarm row in the Alarms List contains an object icon that identifies the source of the alarm, an alarm icon that indicates the severity of the alarm, the time when the alarm occurred, and the text of the alarm. The columns are sortable so that alarms can be listed in order by source, severity, time, or message. Simply click a column heading to sort the table by that column.

Figure 60. Alarms List view

If you click an alarm’s severity icon, a popup for acknowledging or clearing that alarm is displayed. The popup provides a lot of pertinent information about the alarm, such as the rule of origin for the alarm, the history of the alarm, and all of the notes attached to the alarm. If you click the message or any other column in the row, you are provided with a popup menu. From the popup menu, you can choose to view a VMware Explorer dashboard for the corresponding object.

For more information about managing alarms with the Foglight for VMware browser interface, see the Foglight for VMware User Guide.

The Alarms List view takes up the majority of that dashboard.
Alarm Message. An explanation about why the alarm occurred.
Object indicator. Indicates if the alarm is related to a virtual center , datacenter , cluster , ESX host , resource pool , virtual machine , datastore , agent , or logical drive .
Rule Name. The name of the rule that triggered the alarm.
Severity. Indicates the alarm severity: Warning, Critical, or Fatal.
Time. The time at which the alarm was generated.

Drill down on:

Alarm Message, Object indicator, Rule Name, or Time. For server and virtual machine objects, the Select Drilldown dwell appears.
From here, selecting VMware Explorer shows the selected server or virtual machine in the VMware Explorer, with the Summary tab open. Selecting Quick View shows the selected component in the Quick-View.
Severity. Displays the Alarm dialog box, showing additional information about the alarm. For more information about alarms in Foglight, see the Foglight User Help.

VMware Explorer views

The VMware Explorer dashboard contains the following views:

Administration tab

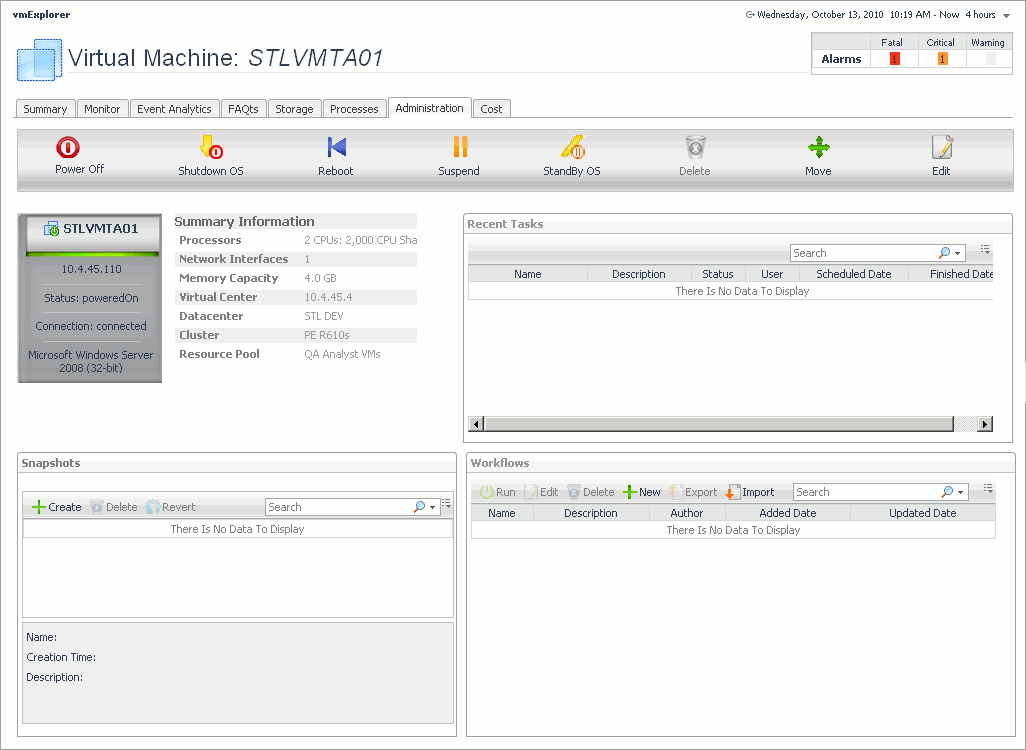
The VMware Explorer’s Administration tab provides access to common administrative tasks. It also shows configuration details for a server or a virtual machine (depending on the selected object type), and some high-level information about the object’s resource consumption.
2
On the Virtual Infrastructure view, that appears on the navigation panel, select an ESX host or virtual machine instance.
3

This view is made up of the following embedded views:

Table 9. Recent Tasks

This table lists the tasks that are performed for the selected ESX host or virtual machine.

Description. The task description.
Finished Date. The date on which the task finished.
Name. The task name.
Scheduled Date. The date on which the task is scheduled to run.
Status. The task status.
User. The Foglight for VMware user who started the task.

Shows the basic configuration details for the selected ESX host.

Shows physical configuration details for the selected ESX host.

Cluster. The name of the cluster to which the selected ESX host belongs, if applicable.
Computing Capacity. The CPU resources available to the selected ESX host.
Datastores. The number of datastores associated with the ESX host.
Memory Capacity. The memory capacity of the selected ESX host.
Processors. The number of CPUs used by the selected ESX host.
Virtual Center. The IP address of the associated vCenter.
Virtual Machines. The number of virtual machines running on the selected ESX host.

Contains buttons for initiating common administrative tasks.

Create VM. Creates a virtual machine on the selected ESX host.
Enable Maintenance. Enables maintenance of the selected ESX host.
Reboot. Reboots the selected ESX host.
Shutdown. Shuts down the selected ESX host.
Table 13. Snapshots

Contains a hierarchical view of the selected virtual machine’s snapshots. It also contains buttons for initiating common administrative tasks.

Create. Creates a virtual machine snapshot.
Delete. Deletes a selected virtual machine snapshot.
Revert. Reverts to a selected virtual machine snapshot.

Shows the name of the selected virtual machine and its basic configuration, including its IP address, status, machine name, configuration, virtualization application (VMWare), and the guest OS.

Shows a list of virtual machines associated with the selected ESX host.

CPU. The current percentage of the selected virtual machine’s CPU load, used to execute system code and user programs, based on the total CPU capacity allocated to that virtual machine.
Name. Virtual machine name.
Memory. The total amount of memory that is available to the virtual machine.

Shows additional configuration details for the selected virtual machine.

Cluster. The name of the cluster to which the virtual machine belongs.
Datacenter. The name of the datacenter associated with the virtual machine.
Memory Capacity. The amount of memory available to the selected virtual machine.
Network Interfaces. The number of network interface cards used by the selected virtual machine.
Processors. The number of CPUs used by the selected virtual machine.
Resource Pool. The name of the resource pool associated with the virtual machine.
Virtual Center. The IP address of the Virtual Center the virtual machine belongs to.

Contains buttons for initiating common administrative tasks.

Delete. Deletes the selected virtual machine.
Edit. Edits the settings of the selected virtual machine.
Move. Moves the selected virtual machine.
Power On. Starts the selected virtual machine.
Reboot. Restarts the selected virtual machine.
Shutdown OS. Shuts down the guest OS on the selected virtual machine.
StandBy OS. Causes the guest OS to be in standby mode.
Suspend. Suspends the selected virtual machine.
Table 18. Workflows

This view contains a list of the available workflows along with buttons for creating and editing workflows. A workflow is a collection of tasks that are arranged into a specific order, that you can run multiple times against the same or different set of objects. It provides a way to automate common scenarios and simplify administration in general. For each workflow, this view contains its name and description, the dates on which the workflow was added and updated, and the name of the Foglight user who created the workflow. You can use this view to create, edit, delete, and run workflows, and to import or export them to a file.

Added. The date on which the workflow was added.
Author. The name of the Foglight for VMware user who created the workflow.
Delete. Deletes a selected workflow.
Description. The workflow description.
Edit. Edits a selected workflow.
Export. Exports a selected workflow to a file.
Import. Imports a workflow from a file.
Name. The workflow name.
New. Creates a new workflow.
Run. Runs a selected workflow.
Updated. The date on which the workflow was updated.

Cost tab

The VMware Explorer’s Cost tab contains information about the costs associated with the selected host’s usage. The information about these costs is provided by the cost models and host assignments that are configured in the Foglight for Chargeback. For more information about the Foglight for Chargeback, see the Managing Chargeback User and Reference Guide.
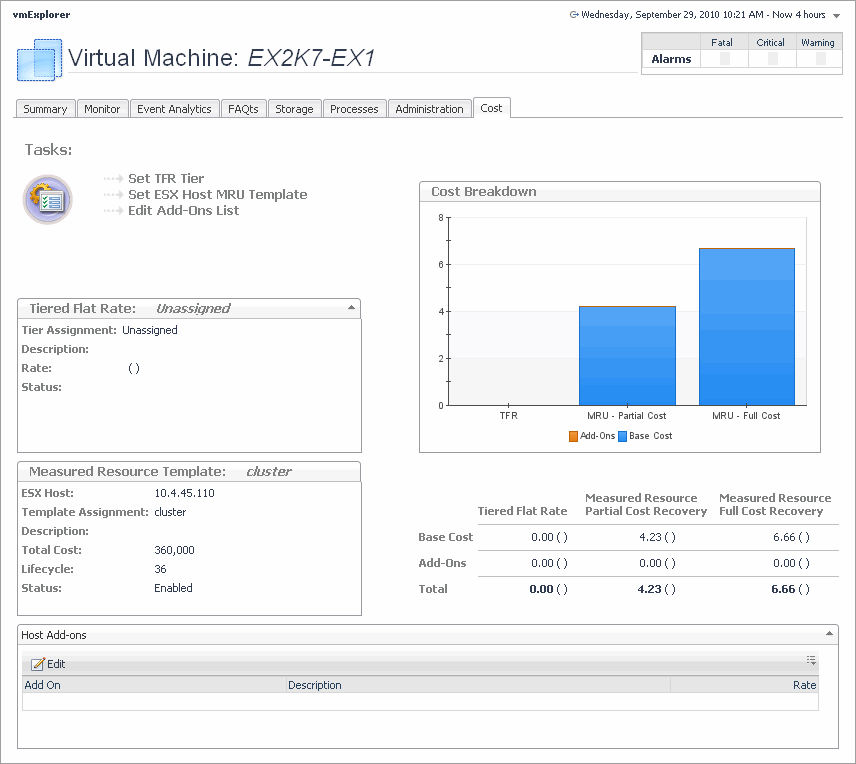
Figure 62. Cost tab

2
On the Virtual Infrastructure view, that appears on the navigation panel, select a virtual machine instance.

This view is made up of the following embedded views:

Table 19. Cost Breakdown

Shows the levels of Tiered Flat Rate (TFR) and Measured Resource Utilization (MRU), including the base cost and the cost of add-on’s, if applicable.

Add-Ons. Shows the cost of upgrades to standard host configurations. These upgrades could include hardware, software, licensing, or even infrastructure items such as rack space or power backup units.
Base Cost. Shows the cost of a standard host configuration.
Table 20. Host Add-ons

Lists the existing host add-on’s and allows you to edit the existing add-on’s. Add-on’s are upgrades to any standard host configuration. These upgrades could include hardware, software, licensing, or infrastructure items such as rack space or power backup units. Add-on’s consist of other costs incurred in the IT infrastructure.

Add-On. Contains the name of the add-on.
Edit. Allows you to edit a selected add-on.
Description. Contains the description of the add-on.

Provides an overview of the measured resource template host assigned to the host. Measured Resource Utilization (MRU) is based on actual percentage utilizations of CPU, Memory, Network, and disk IO weight. You can create templates based on these levels.

Description. The description of the template associated with the selected virtual machine.
Hypervisor. The name of the server in which the virtual machine is running.
Lifecycle. The length of time the selected virtual machine will be used.
Status. The template status.
Template Assignment. The name of the template associated with the selected virtual machine.
Total Cost. The total cost of the selected virtual machine for the duration of its life cycle.
Table 22. Tasks

Contains access to wizards that allow you to set up TFR tiers, MRU templates, and edit add-on’s.

Edit Add-Ons List. Starts a wizard that allows you to add add-on’s to the selected virtual machine.
Set MRU Template. Starts a wizard that allows you to create a measured resource template and associate it with the selected virtual machine.
Set TFR Tier. Starts a wizard that allows you to create tiers and associate them with the selected virtual machine. A tiered flat rate (TFR) is a pre-configured level of expense that is associated with a virtual machine.

Provides an overview of the tiered flat rate assignment. A tier is a level of expense for a host machine. Using the Tiered Flat Rates (TFR) you can determine monthly costs of the selected virtual machine.

Description. The description of the tiered flat rate associated with the selected virtual machine.
Rate. The rate of the tier cost over time.
Status. The tier status.
Tier Assignment. The name of the tiered flat rate associated with the selected virtual machine.
関連ドキュメント

The document was helpful.

評価を選択

I easily found the information I needed.

評価を選択