Summary - Standard Virtual Switch view
The Summary - Standard Virtual Switch view illustrates the overall network utilization and the levels of overall network packet loss for a selected standard virtual switch.
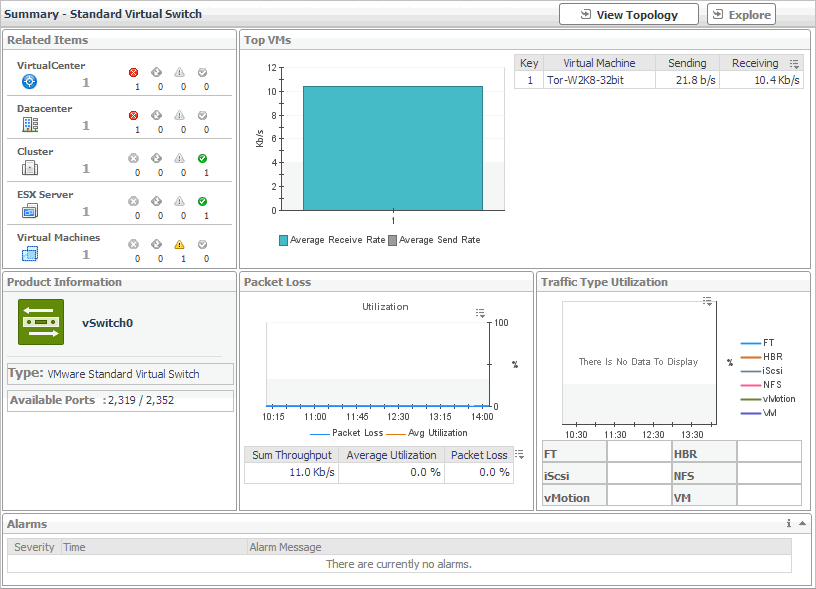
The Summary - Standard Virtual Switch view appears on the right.
This view is made up of the following embedded views:
|
|
Shows the numbers and states of the objects in your environment associated with the selected switch. |
|
|
|
• |
Cluster. Represents the cluster associated with the selected switch, followed by the counts of alarms generated against that cluster in each severity state. | |
|
|
|
• |
Datacenter. Represents the datacenter associated with the selected switch, followed by the counts of alarms generated against that datacenter in each severity state. | |
|
|
|
• |
Virtual Center. Represents the virtual center associated with the selected switch, followed by the counts of alarms generated against that virtual center in each severity state. | |
|
|
|
• |
Virtual Machine. Represents the virtual machines associated with the selected switch, followed by the counts of alarms generated against those virtual machines in each severity state. | |
|
|
Drill down on: |
|
|
|
• |
Alarm count. Displays the Alarms dialog box that shows a list of all related alarms. For each alarm entry, it shows its severity, the time at which it was triggered, the rule name that triggered the alarm, and the alarm message. | |
|
|
|
• |
Cluster. Displays the Clusters Inventory dwell, showing the name and state of the cluster associated with the selected switch. |
|
|
|
|
• |
Datacenter. Displays the Datacenters Inventory dwell, showing the name and state of the datacenter associated with the selected switch. |
|
|
|
|
• |
Virtual Center. Displays the Virtual Centers Inventory dwell, showing the name and state of the virtual center associated with the selected switch. |
|
|
|
|
• |
Virtual Machines. Displays the Virtual Machines Inventory dwell, showing the name and state of each virtual machine associated with the selected switch. |
|
Summary - Distributed Virtual Switch view
The Summary - Distributed Virtual Switch view illustrates the overall network utilization and the levels of overall network packet loss for a selected distributed virtual switch.
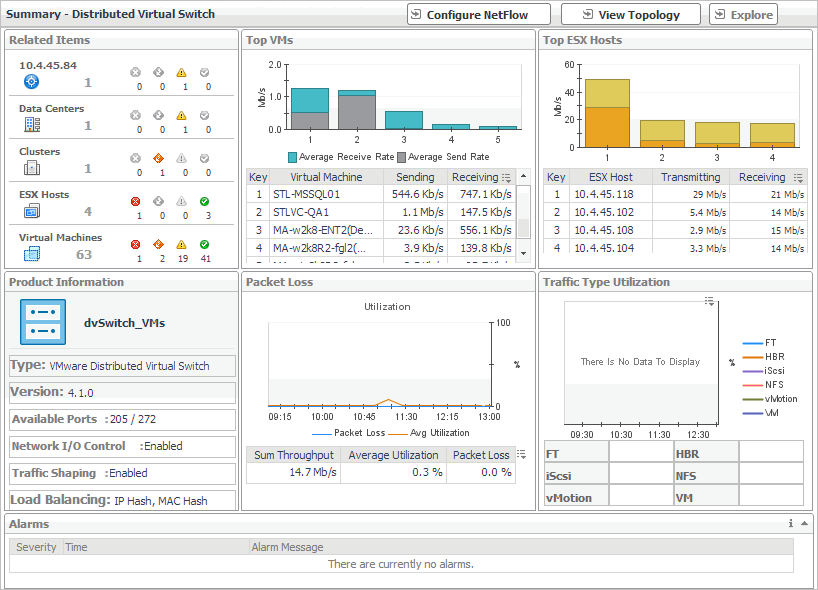
The Summary - Distributed Virtual Switch view appears on the right.
NetFlow is a network protocol that enables distributed virtual switches to collect IP traffic information as the data flow enters or exits an interface. These statistics can later be exported and serve as a basis for potential traffic analysis. You can enable this feature on desired distributed virtual switches.
The NetFlow data can be collected from your monitored environment only if your VMware user account includes the following privileges:
For additional information about these privileges, see your VMware documentation.
|
1 |
In the Summary - Distributed Virtual Switch view, click Configure NetFlow. |
The Netflow Setting dialog box appears.
|
2 |
In the Netflow Setting Dialog box, provide the following information: |
|
• |
IP Address and UDP: Type the IP address and port number of the NetFlow collector. |
|
• |
VDS IP Address: Type the IP address of the distributed virtual switch. |
|
• |
End Time: Select the time when you want the collector to stop obtaining NetFlow data. |
|
• |
Sampling rate: Type a number indicating how often you want to collect data packets. For example, a value of 2 instructs the collector to obtain data from every second packet. |
|
• |
Process Internal Flows: Select this check box if you want to collect data only during network activities between virtual machines on the same host. |
This view is made up of the following embedded views:
For complete information about this view, see Alarms .
For complete information about this view, see Packet Loss .
|
|
Shows the name of the selected switch along with some basic configuration information. |
|
|
|
• |
Available Ports. The number of switch ports that are available for use out of the total number of ports. | |
|
|
|
• |
Load Balancing. One or more load balancing policies, indicating how the switch routes network traffic in case of an adapter failure. For example, an uplink may choose a route based on the originating virtual port, IP hash, source MAC hash, physical NIC load, or use a specified fail over order. For more information about these policies, see your VMware documentation. | |
|
|
|
• |
Network I/O Control. Indicates if the selected switch can use network resource pools to prioritize network traffic. | |
|
|
|
• |
Traffic Shaping. Indicates if the traffic shaping policy is enabled or disabled on the selected switch. A traffic shaping policy can restrict the network bandwidth to a port or if a port is configured to temporarily allow transmission of data at higher than normal speeds. For more information about these policies, see your VMware documentation. | |
|
|
|
• |
Type. The type of the switch: VMware Distributed Virtual Switch. | |
|
|
|
• |
Version. The version number of the distributed switch component in your virtual environment. | |
|
|
Drill down on: |
|
|
|
• |
Product Information. Displays a dwell, providing additional configuration information about the selected distributed virtual switch. |
To find out more about the network I/O traffic passing through the selected switch, in the dwell, on the right of Network I/O Control, click Enabled.
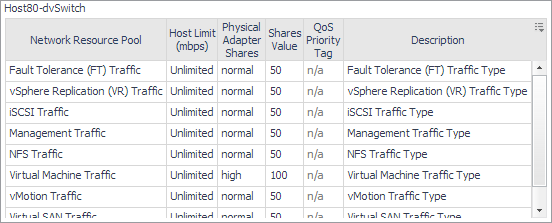
To find out more about the traffic shaping policy, on the right of Traffic Shaping, click Enabled.

|
For complete information about this view, see Related Items .
For complete information about this view, see Top VMs .
For complete information about this view, see Top VMs .
Summary - Cisco Virtual Switch view
The Summary - Cisco Virtual Switch view illustrates the overall network utilization and the levels of overall network packet loss for a selected Cisco virtual switch.
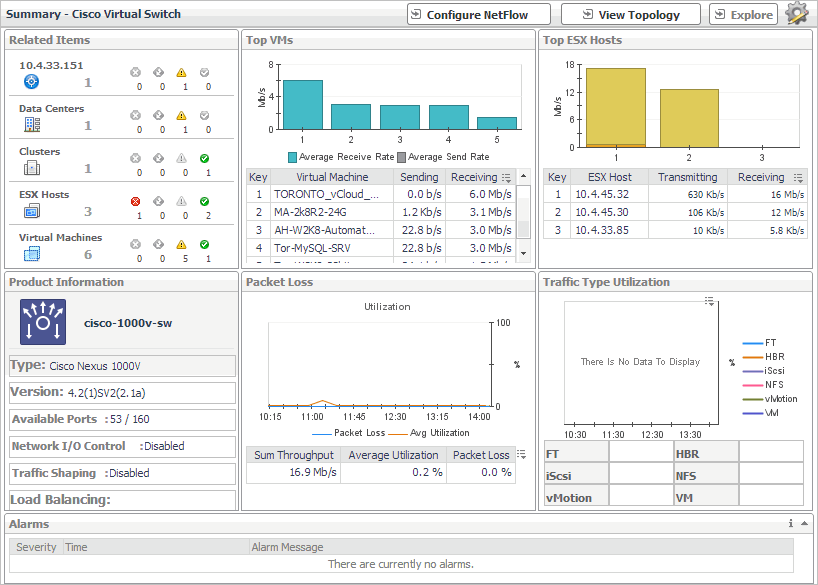
The Summary - Cisco Virtual Switch view appears on the right.
NetFlow is a network protocol that enables distributed virtual switches to collect IP traffic information as the data flow enters or exits an interface. These statistics can later be exported and serve as a basis for potential traffic analysis. You can enable this feature on desired Cisco virtual switches.
The NetFlow data can be collected from your monitored environment only if your VMware user account includes the following privileges:
For additional information about these privileges, see your VMware documentation.
The Netflow Setting Dialog box appears.
|
2 |
In the Netflow Setting Dialog box, provide the following information: |
|
• |
IP Address and UDP: Type the IP address and port number of the NetFlow collector. |
|
• |
VDS IP Address: Type the IP address of the distributed virtual switch. |
|
• |
Username and Password: Type the credentials needed to access the Cisco virtual switch. |
|
• |
End Time: Select the time when you want the collector to stop obtaining NetFlow data. |
|
• |
Sampling rate: Type a number indicating how often you want to collect data packets. For example, a value of 2 instructs the collector to obtain data from every second packet. |
|
• |
Process Internal Flows: Select this check box if you want to collect data only during network activities between virtual machines on the same host. |
This view is made up of the following embedded views:
For more information about these views, see Description of Embedded Views
Standard vSwitch Topology and Distributed vSwitch Topology views
The Standard vSwitch Topology View and Distributed vSwitch Topology View visualize the relationships between the objects in your environment through an interactive dependency map. The map illustrates how different components relate to each other, and the levels of the available resources available to them.
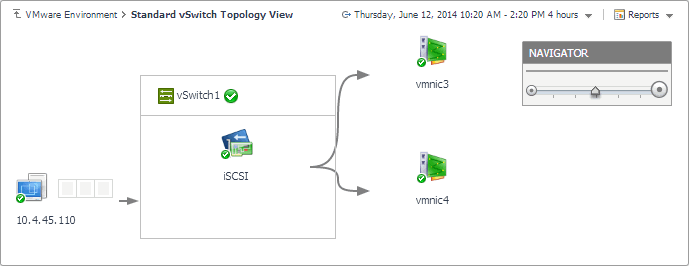
Topology views are also available for other components on the VMware Environment dashboard. For complete information about topology views, see Topology views .
The Standard vSwitch Topology View appears in the display area.
The Distributed vSwitch Topology View appears in the display area.
The Distributed vSwitch Topology View appears in the display area.