サポートと今すぐチャット
サポートとのチャット

Foglight for DB2 (Cartridge) 6.0.0.10 - User Guide

Introduction to Foglight for DB2 LUW Using Foglight for DB2 LUW Reference
Dashboards and Views Collections and Metrics
CF Locks Collection CF Memory Pools Collection CF Resource Usage Collection Current Agents Details Collection Agents Summary Collection Current Locks Wait Collection Database Bufferpools Summary PS Collection Database Configuration Collection Database Tablespaces Collection Database Tablespaces Summary Collection Database Usability Collection Database Parameters Collection Database Instance Parameters Collection Database Instance Registry Variables Collection Database Tablespaces BP Collection FCM Activity Collection FS DB Storage Collection FS DB Storage Summary Collection FS Instance Storage Collection FS Storage Collection FS Storage Summary Collection General Activity Collection HADR Activity Collection Host Properties Collection OS General Collection Instance Activity Collection Instance General Collection Instance Nodes Collection Instance Usability Collection IO Activity Collection License Details Collection Log Activity Collection Log File Collection Log Message Collection Messages Count Collection Monitor Switches Collection OS DB2 General Process Collection Partition Tablespaces Summary Collection Partition Usability Collection pureScale Alerts Collection Top SQLs Collection Query Agents Details Collection Database Partition Activity Collection DB2 Partition Subcategories Wait Collection History Locks Wait Collection History Locks Summary Collection Instance Memory Collection Instance Memory Pool Collection Instance Memory Summary Collection Instance Memory Total Collection Database Memory Collection Database Memory Pool Collection Database Memory Pool DB Collection Database Memory Summary Collection Database Memory Total Collection Database Buffer Pools Collection Database Tables Collection Database Partition Backup Collection Database Tables Global Collection Database Applications Collection

Memory Panel

The Memory Summary panel provides memory summary metrics on the members and memory pools for the selected database.

To access the Memory Summary panel, navigate through Databases > Instance Homepage > Database Homepage, and then choose Memory > Memory summary.

For more information, see Memory Summary Pane.

The Buffer Pools panel provides performance metrics on the buffer pools for the selected database.

To access the Buffer Pools panel, navigate through Databases > Instance Homepage > Database Homepage, and then choose Memory > Buffer Pools.

For more information, see Buffer Pools Pane.

Storage Panel

All database data is stored in a number of Tablespaces. There are different types of tablespaces, including catalog, regular, large, system-temporary, and user-temporary tablespaces. Tablespaces can be managed by the OS (System-Managed Space — SMS) or the database (Database-Managed Space — DMS). Each tablespace can have one or more containers. Each tablespace has a page size associated with it, which limits the row length and column count of tables that can be placed in the tablespace, meaning that a larger page increases the capacity of the tablespace. The utilization of the page size has an effect on the usage of overall tablespace resources. For example, having a small table with a large page size results in a significant amount of wasted space and inefficient I/O and buffering usage.

The Tablespaces panel shows the top ten tablespaces with the highest percentage of the space usage, along with individual table properties for each individual tablespace. Use this panel to quickly investigate the existing tablespace usage and look for parameters that can indicate potential performance issues.

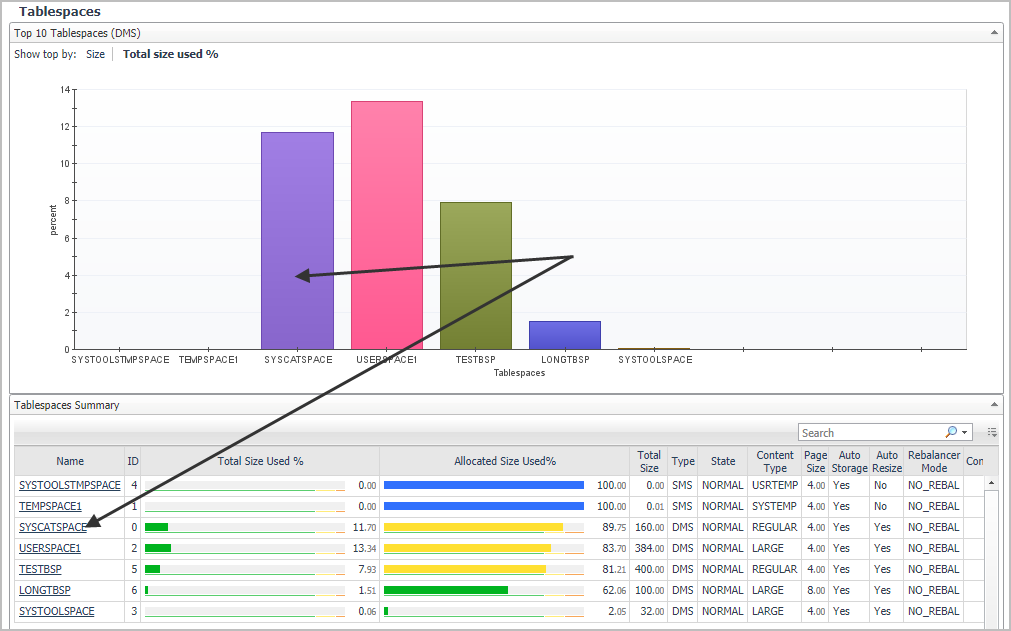
To access the Tablespaces panel, navigate through Databases > Instance Homepage > Database Homepage, and then choose Storage > Tablespaces.

You can also access the Tablespaces panel for a database from the Databases Dashboard by clicking the icon at the far right of the database name cell and then selecting Tablespaces from the menu that appears.

For more information about this panel, see Tablespaces .

The Tablespace Details view shows individual tablespace properties and metrics. This dashboard also provides space utilization and free space fragmentation charts that can give you insight in how well the system can perform based on the existing storage resources. For example, a high amount of fragmented disk space can lead to increased performance overhead. You drill down to this view by clicking a tablespace entry on the Tablespaces dashboard or clicking on the tablespace name in the Tablespace Summary section.

For more information about this view, see Tablespace Details .

A buffer pool is memory that temporarily stores data and index pages from the database. If an application needs to read a data or index page and that page is already in the buffer pool, the application reads the page from the buffer pool, a process that is faster than retrieving the page from disk. Avoiding disk I/O is a critical issue when you are trying to improve database logical and physical read performance.

The Tablespaces Bufferpools Activities panel shows the top tablespaces with the highest percentage of the space usage, and for each tablespace, it displays its buffer pool usage, such as data reads and writes. Use this dashboard to quickly investigate the buffer pool usage for the top tablespace consumers, and to look at the overall buffer pool performance.

To access the Tablespaces Bufferpool Activities panel, navigate through Databases > Instance Homepage > Database Homepage, and then choose Storage > Tablespaces Bufferpool Activities.

For more information about this panel, see Tablespaces .

Diagnostic Log Panel

The Diagnostic Log panel provides a graphic, color-coded representation of the notification log messages, sorted by their severity level, as detailed below. Informational messages and warnings are displayed here, but do not invoke alarms.

To access the Diagnostic Log panel, navigate through Databases > Instance Homepage > Database Homepage, and then choose Log.

For more information, see Log Drill-down.

Initialization Parameters Panel

The Initialization Parameters panel provides the list of initialization parameters with their current values and other pertinent information, sorted in alphabetical order.

To access the Initialization Parameters panel, navigate through Databases > Instance Homepage > Database Homepage, and then choose Configuration.

For more information, see Configuration Drill-down.

関連ドキュメント

The document was helpful.

評価を選択

I easily found the information I needed.

評価を選択