サポートと今すぐチャット
サポートとのチャット

Foglight for Exchange 6.0.0 - User Guide

Navigation basics Exploring the Foglight for Exchange dashboards Managing Exchange agents Reporting on your Exchange environment Foglight for Exchange views
Role views Exchange Server views Site views Cluster views Description of Embedded views
Agent State view Alarms view Auto Attendant Calls view Auto Attendant Directory Access view Auto Attendant General view Auto Attendant Transfers view Cached LDAP Searches/sec view CAS AB Load view CAS AB Service view CAS Control Panel Load view CAS Load view CAS OAB Download view CAS RPC Client Access view CAS RPC Client Access Load view CAS RPC HTTP view Client Access Features view Cluster Database Details view Cluster Storage Group Details view Cluster Summary and Resource Information view Cluster Summary view Clusters Listing view CPU view Disk view Domain Controllers view Edge Agent view Edge Transport Features view Exchange Roles Server Summary view Exchange Server Roles view (reference information) Exchange Servers in This Cluster view Exchange Servers view (Exchange Cluster Environment Summary) Exchange Servers view Host Monitor view Hub Transport Features view IP Address view Mailbox Features view Mailbox Store Assistant view Managed Availability Recovery Action Results view Memory view Network view Processes LDAP Read Time view Resource Utilization view Roles Listing view Roles Explorer view Role Features State view Roles Top 3 view Server Health view Server Listing view Servers in Site view Servers In This Site view Site By Category view Site Listing view Store Calendar Attendant view Store Client Search view Store Content Indexing view Store Database view Store Public Load view Store Resource Booking view Store RPC Client Throttling view Store Transport view Store User Load view Summary and Resource Information view Top 3 CPU Consumers view Top 3 Memory Consumers view Top 3 Network Consumers view Top 3 Storage Consumers view Total LDAP Read Time On All DCs view Total Long-Running LDAP Operations On All DCs view Transport Dumpster view Transport Edge Sync view Transport Extensibility Agent view Transport Load Store Drivers view Transport Queues view UM Availability view UM Call Answer General view UM Call Answer view UM Fax view UM General Current view UM General view UM Subscriber Access Calendar view UM Subscriber Access Directory view UM Subscriber Access General view UM Subscriber Access Message view Unified Messaging Features view Windows Services view
Foglight for Exchange rules Running diagnostic tests Managing Exchange metrics

Exchange Server Roles view

The Exchange Server Roles view displays performance metrics and information for the Exchange roles being performed by the selected Exchange server. The content of this view is based on the Exchange role selected at the top of the view.

1
From the Foglight navigation panel, select Dashboards > Exchange > Exchange Explorer.
3
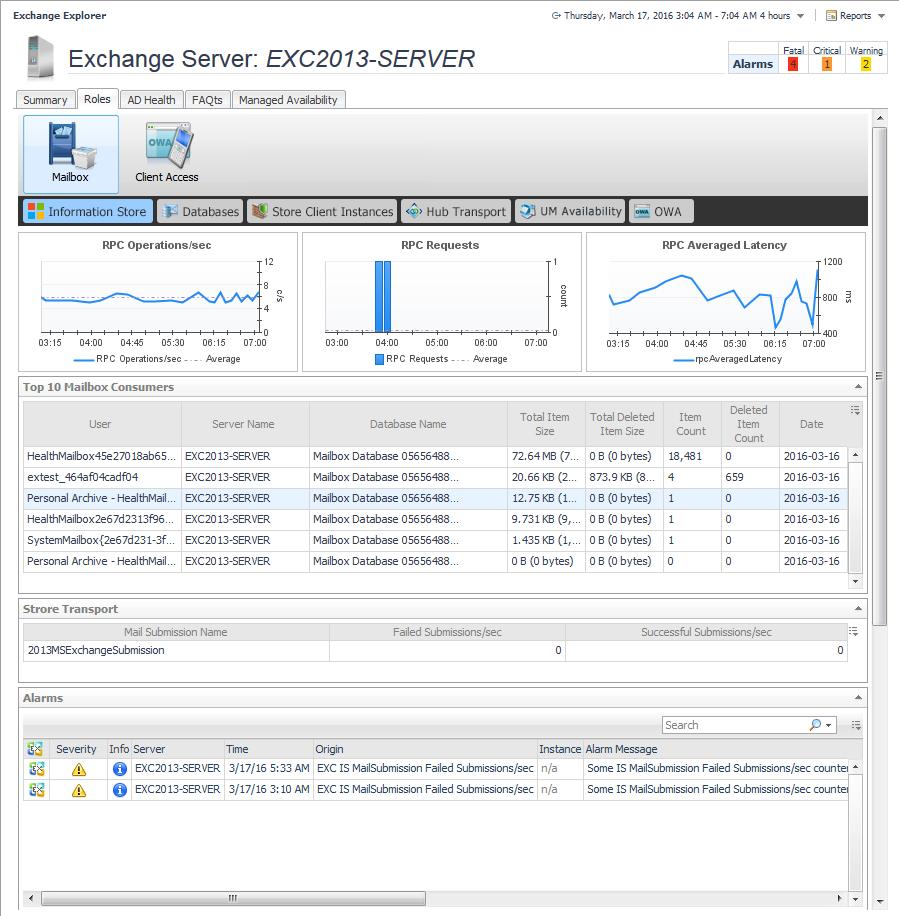
Select the Roles navigation tab.

The embedded views in this view are dependant upon the Exchange role selected at the top of the Exchange Server Roles view. For detailed information about the embedded views, see Exchange Server Roles view (reference information).

Client Access

OWA1

Edge Transport

Hub Transport

Mailbox

Hub Transport2
UM Availability3
OWA4

Unified Messaging


1

Available only for Exchange 2007, 2010 client access role.


2

Available only for Exchange 2013 and 2016 mailbox role.


3

Available only for Exchange 2013 and 2016 mailbox role.


4

Available only for Exchange 2013 and 2016 mailbox role.


Exchange Server AD Health view

The Exchange Server AD Health view displays performance health information about the DCs in your Active Directory® environment.This view is not available for Exchange 2016.

1
From the Foglight navigation panel, select Dashboards > Exchange > Exchange Explorer.
3
Select the AD Health navigation tab.

The following embedded views are displayed:

Exchange Server Managed Availability view

When an individual Exchange 2013 or 2016 server is selected in the Exchange Infrastructure view, the Managed Availability navigation tab appears. The Managed Availability process addresses availability and latency issues or errors by triggering applicable actions. These actions are displayed on the Managed Availability view.

1
From the Foglight navigation panel, select Dashboards > Exchange > Exchange Explorer.
3
Select the Managed Availability navigation tab.
The Exchange Server Managed Availability view appears in the Primary view on the Exchange Explorer dashboard.

This view contains the following embedded view:

Site views

The following views are available to monitor the health of the sites within your Active Directory® environment that are hosting Exchange servers:

関連ドキュメント

The document was helpful.

評価を選択

I easily found the information I needed.

評価を選択