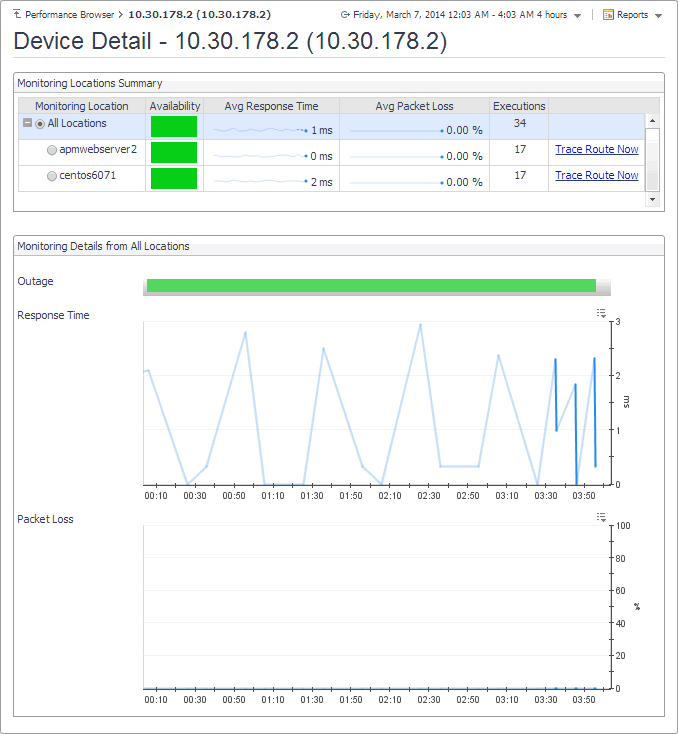
When you select a network device in the Summary - All Devices view, you can see additional information, such as response times and packet loss values, in the Device Detail view. High levels of these indicators typically point to network congestion, and may require additional investigation.
For complete details about the data appearing on this view, see Device Detail view.
|
1 |
On the Performance Browser dashboard, select the Network Devices tile. |
|
2 |
In the Network Devices Quick View, in the Network Devices panel on the left, select a network device. |
|
3 |
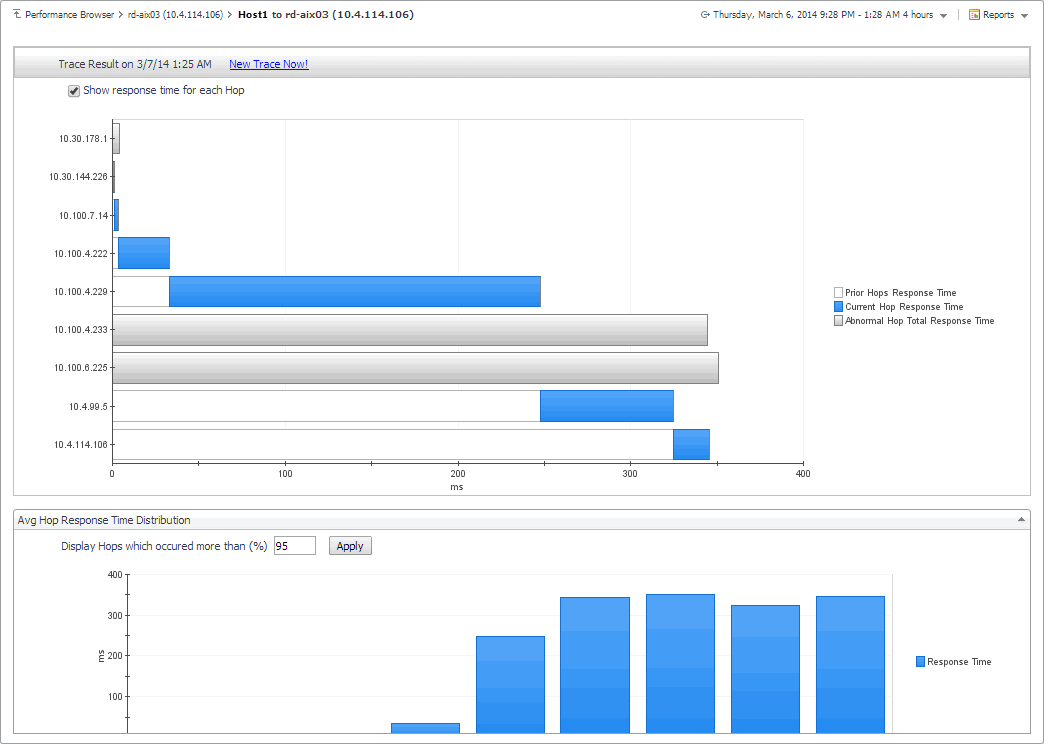
When you monitor a network device from a monitoring location, the monitoring agent sends a configured number of data packets to the device. The complete path of each data packet, from the monitoring location to the network device, represents a route. On the way to its destination, a data packet often runs through a number of other devices, so the route consists of one or more hops, where each device it passes through is counted as one hop.
The Trace Result view allows you to trace a route between a monitoring location and a network device, and review the time a data packet spends at each individual hop. This can help you investigate signs of performance degradation. For example, if your system reports higher than usual response times and frequent time-outs, you can trace the route of data packets to determine what is causing the bottlenecks.
For complete details about the data appearing on this view, see Trace Result view.
|
1 |
On the Performance Browser dashboard, select the Network Devices tile. |
|
2 |
In the Network Devices Quick View, in the Network Devices panel on the left, select a network device. |
|
3 |
|
4 |
On the Device Detail dashboard, in the Monitoring Locations Summary view, in the row containing the monitoring host from which data packets are sent to the device, click Trace Route Now. |
|
IMPORTANT: If the trace route option is disabled in the device settings (see Viewing and editing individual network device details), this page is not populated with data. You can quickly execute a trace route in real time on this page by clicking Trace Route Now. |
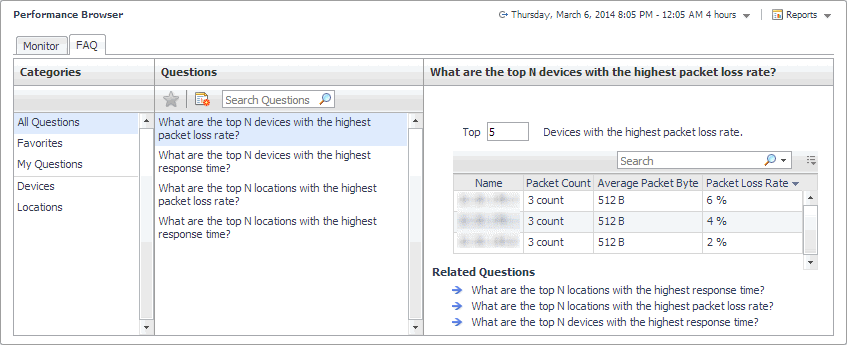
The FAQ tab available on the Performance Browser allows you to look at frequently asked questions about your monitored devices and review the answers. The Categories view shows several question categories. Selecting a category shows the questions belonging to that category in the Questions pane. From there, clicking a question shows the answer on the right.
You can generate, copy, and edit reports using the Reports dashboard included with the Foglight Management Server. For more information about this dashboard, see the Foglight User Help.
|
Shows network device availability over the specified time range, per monitoring location. | |