After installing Foglight Change Analyzer, the Change Analyzer tab appears in the VMware Environment dashboard.
|
2 |
|
3 |
Click the Change Analyzer tab. |
For detailed information about navigating the Foglight Change Analyzer user interface, see the “Navigation basics” topic in the Foglight for VMware User and Reference Guide.
When you install Foglight for Virtualization, Enterprise Edition or Foglight Evolve, the Environment Overview dashboard > Investigate tab provides an overview of changes with the highest impact on your environment. For more information, see Highest Impact Changes.
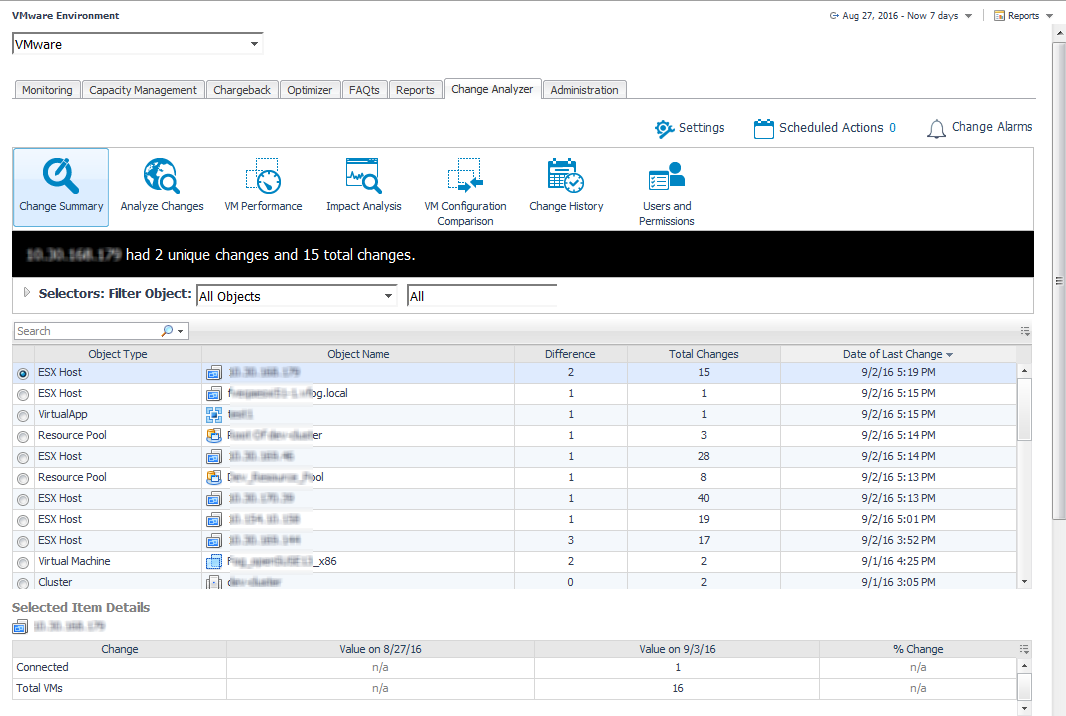
When you install Foglight Change Analyzer and a Foglight system, the Change Analyzer tab appears in the VMware Environment dashboard. It provides several ways of analyzing the changes made to your virtual infrastructure, and of assessing their impact on your virtual environment.
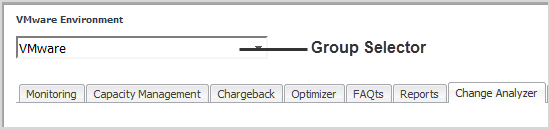
You begin this process by using the Group Selector, located in the upper left section of the VMware Environment dashboard, to select the virtual environment that you want to monitor. The Foglight Change Analyzer views display the changes made to the selected virtual environment and assess their impact on that virtual environment.
Select the timeframe for the analysis from the Time Range located on the top right corner of the VMware Environment dashboard.
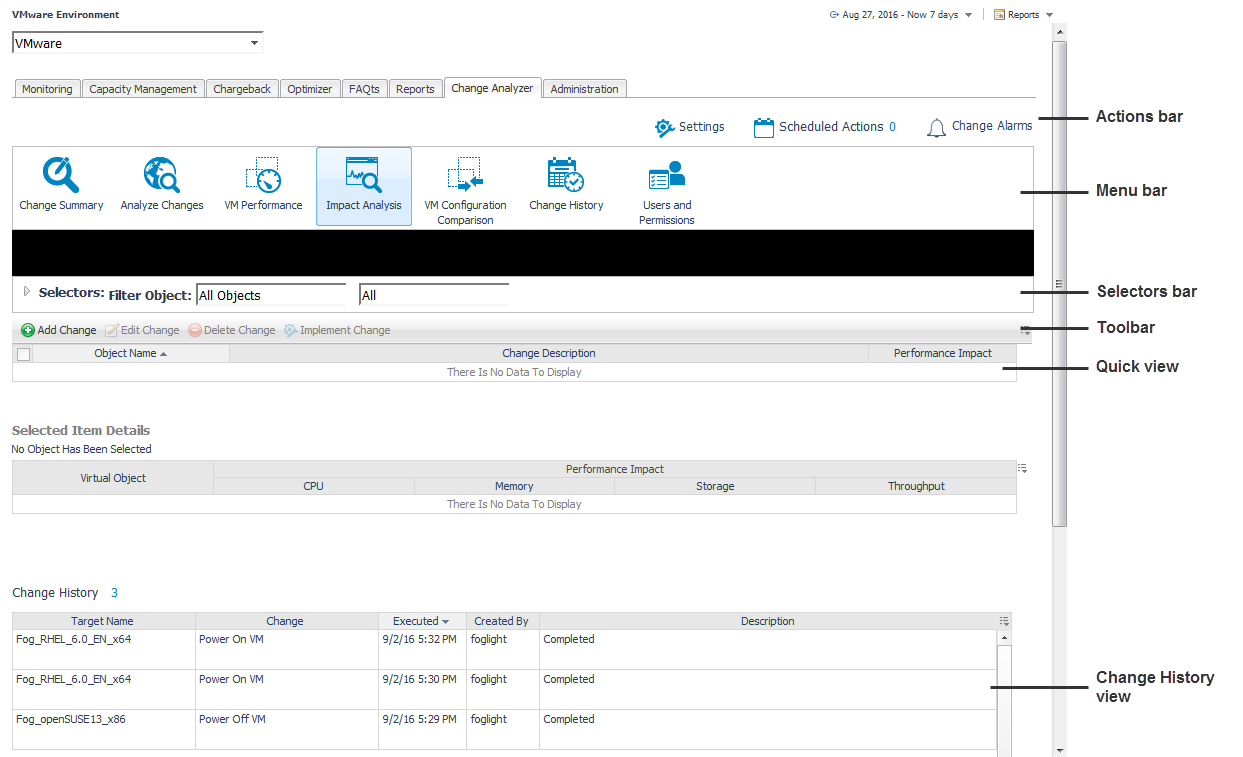
The Change Analyzer tab includes the following elements:
|
• |
|
• |
|
• |
Scheduled Actions. Click this icon to open the Scheduled Actions dialog box. It allows you to view and modify the list of actions scheduled to be run at a particular time in the future. For details, see Scheduled Actions. |
|
• |
Change Alarms. Click this icon to open the Change Alarms dialog box. It allows you to define and manage alarms to be triggered when changes that occur in your environment pose performance or security risks. For details, see Change Alarms. |
|
• |
|
• |
Change Summary. Click this icon to open the Change Summary view. This view shows all the changes that occurred to VMs, hosts, clusters, datastores, and resource pools within a selected environment, during a selected timeframe. For details, see Change Summary. |
|
• |
Analyze Changes. Click this icon to open the Analyze Changes view. This view allows you to analyze what is changing performance-wise in a selected environment, during a selected timeframe. For details, see Analyze Changes. |
|
• |
VM Performance. Click this icon to open the VM Performance view. This view allows you to analyze the performance of a selected VM, during a selected timeframe. For details, see VM Performance. |
|
• |
Impact Analysis. Click this icon to open the Impact Analysis view. This view allows you to define a sequence of changes and see what impact those changes have on your system’s performance. It also allows you to trigger the execution of these changes immediately or schedule these changes within Foglight, Foglight for Virtualization, Enterprise Edition, or Foglight Evolve. For details, see Impact Analysis. |
|
• |
VM Configuration Comparison. Click this icon to open the VM Configuration Comparison view. This view allows you to compare all VMs within a selected environment to a specific “gold standard” template or reference VM. If they differ, it displays a detailed list of all the configuration differences. For details, see VM Configuration Comparison. |
|
• |
Change History. Click this icon to open the Change History view. This view lists all changes that occurred to VMs, resource pools, hosts, clusters, disks, datastores, and data centers within a selected environment over a selected timeframe. For details, see Change History. |
|
• |
Users and Permissions. Click this icon to open the Users and Permissions view. This view displays the user/group, role, and the privileges the role has, for a selected virtual object. It also identifies where the permissions are defined. For details, see Users and Permissions. |
|
• |
Selectors bar: Provides filters that allow you to select the virtual objects to be included in the change analysis. |
|
• |
Toolbar: Provides functionality for managing change models in the Impact Analysis view. |
|
• |
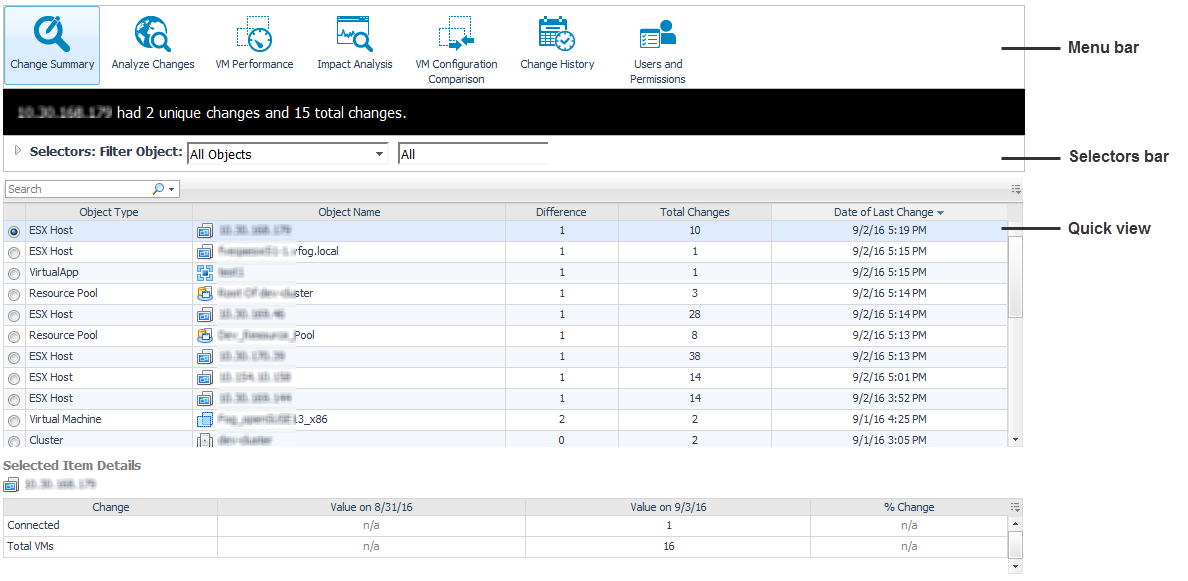
Quick view: Displays the results of the analysis, in table or graph format. |
|
• |
(Impact Analysis) Change History view: Displays the history of changes implemented using the Impact Analysis functionality. |
The Change Summary view shows all the changes that occurred to VMs, hosts, clusters, datastores, and resource pools within a selected environment, during a selected timeframe.
|
1 |
Click the Change Summary icon on the Change Analyzer tab > Menu bar. |
For additional information about this view, see Change Summary view.