Data Collection Scheduler
The Datacenter Collection Scheduler agent properties specify the data frequency settings the Web Monitor agent uses to collect metrics from the monitored Web sites.
|
• |
Collector Config: A list containing the data collectors the agent uses. Each entry in the list includes the following columns: |
|
• |
Collector Name: The name of the collector the Web Monitor Agent uses to gather data. |
|
• |
Default Collection Interval: The number of milliseconds, seconds, minutes, hours, or days during which the Web Monitor Agent collects data. |
|
• |
Time Unit: The time unit associated with the Default Collection Interval. |
|
• |
Fast-Mode Collection Interval: The number of milliseconds, seconds, minutes, hours, or days during which the Web Monitor Agent collects data when working in the fast collection mode. |
|
• |
Fast-Mode Time Unit: The time unit associated with the Fast-Mode Collection Interval. |
|
• |
Fast-Mode Max Count: The maximum number of the times the Web Monitor Agent can stay in fast collection mode. |
View reference
Foglight Web Monitor ships with several dashboards that allow you to monitor and configure your virtual environment. Each of these dashboards contains a number of views. This section describes these views in more detail. For more information about the available dashboards, see Exploring your collection of monitored Web sites, Investigating the performance of Web transactions and monitoring locations, and Exploring Web Monitor services.
This cartridge includes the following groups of views:
Web Monitor Performance Browser views
The Performance Browser contains the following views:
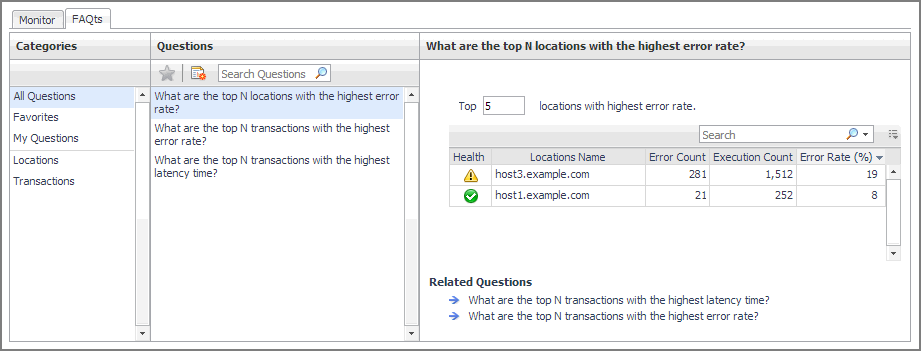
FAQts tab
The FAQts tab shows answers to common questions related to your transactions or locations.
Navigate to the Performance Browser, and open the FAQts tab.
This view is made up of the following embedded views:
|
• |
This view provides an answer to the question selected in the Questions view. The answer appears in the following form:
Top x <objects of category>…
where x is the number of objects of the category you provided in the Categories view.
Specify x by entering a number.
This view lists the categories for which questions can be answered for you by Foglight.
Click a category in the list to select it.
This view lists the questions, for the category selected in the Categories, that can be answered for you by Foglight.
Click a question in the list to select it.
If the list of questions is long and you want to narrow it down, search for a particular text string using the Search Questions box.

