Host tab
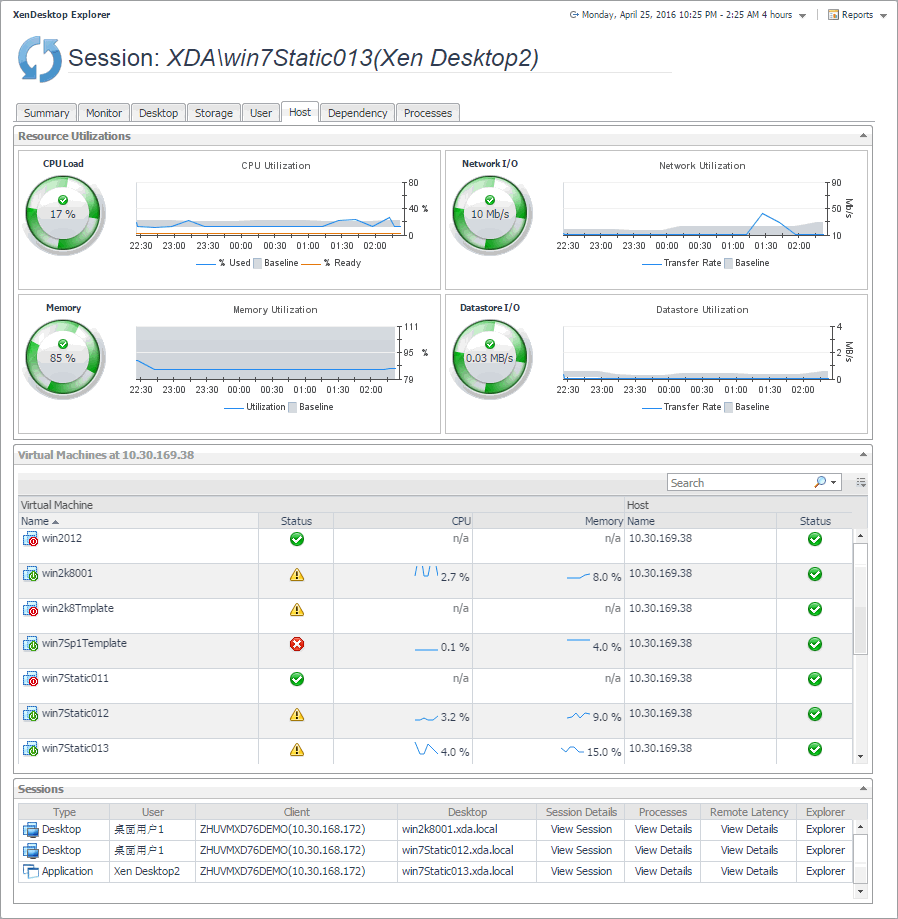
The Host tab shows the usage of system resources for the physical host associated with the selected session. Use it to see the trends in usage of the host’s system resources, to see which virtual desktops and sessions are running on the host, and to look for the signs of compromised performance. For example, high peaks in the memory utilization chart, that drastically exceed historical values could result in performance degradation and should be investigated.
|
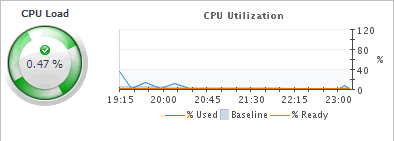
The CPU Load spinner indicates the current percentage of the selected virtual machine’s CPU load, used to execute system code and user programs, based on the total CPU capacity. The % Used line in the CPU Utilization chart shows the percentage of the CPU utilization used by the virtual machine to execute system code and user programs, during the selected time period. % Ready displays the percentage of the virtual machine’s CPU resources that are ready to execute system code and user programs during the selected time period. The Baseline area in the chart indicates the expected CPU utilization range based on historical data. | ||
|
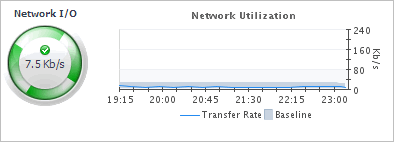
The Network I/O spinner indicates the current rate at which the selected virtual machine transfers data from and to the network. The Transfer Rate line in the Network Utilization chart shows the rate at which the selected virtual machine receives and sends data to the network during the selected time period. The Baseline area in the chart indicates the expected network utilization range based on historical data. | ||
|
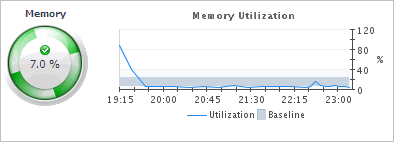
The Memory spinner indicates the current percentage of the average memory usage by the selected virtual machine, based on the total memory capacity. The Utilization line in the Memory Utilization chart shows the percentage of memory used by the virtual machine during the selected time period. The Baseline area in the chart indicates the expected memory utilization range based on historical data. | ||
|
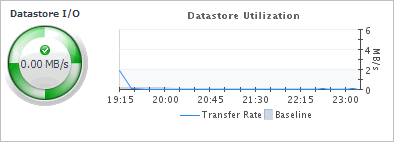
The Datastore I/O spinner indicating the current datastore I/O rate the selected virtual machine utilizes, based on the total datastore capacity. The Transfer Rate line in the Datastore Utilization chart shows the rate at which the virtual machine reads and writes data to the datastore during the selected time period. The Baseline area in the chart indicates the expected datastore utilization range based on historical data. | ||
|
The name of the physical host on which the virtual machine is running. | ||
Dependency tab
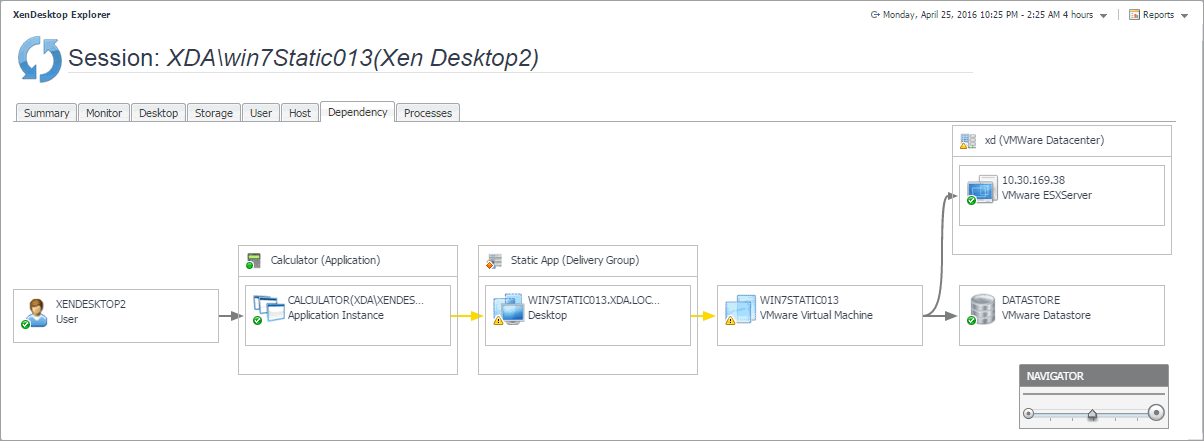
The Dependency tab helps you understand the dependencies between the XenDesktop components associated with the selected session. The dependency map displays the relationships between the XenDesktop user, Desktop, virtual machine, datastore, and physical host. For complete information about dependency maps, see Viewing object dependencies .
Processes tab
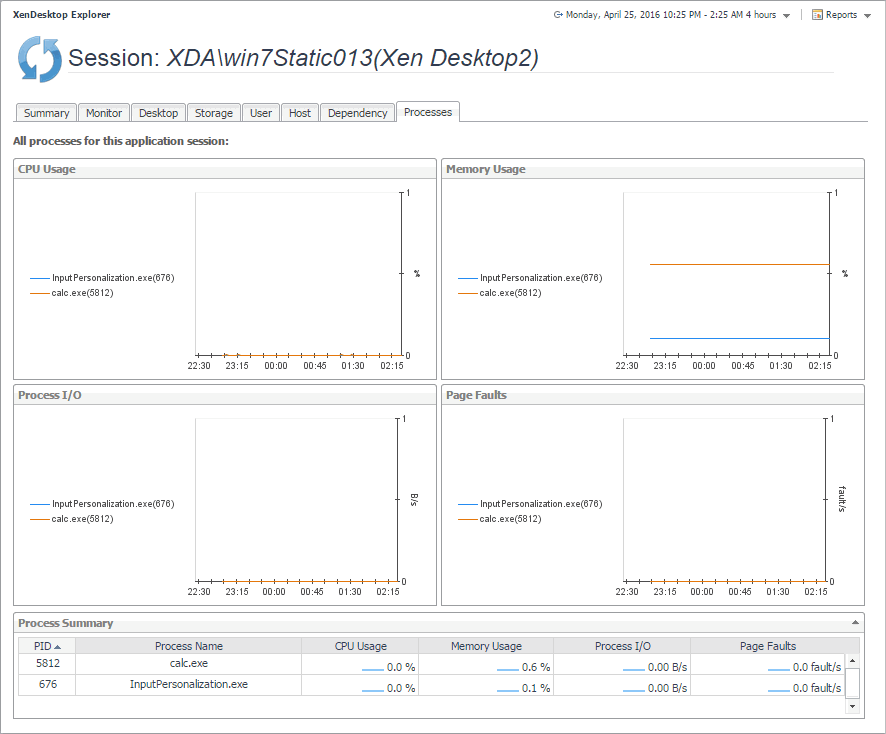
The Processes tab displays an organized view of process information for a selected session.
|
• |
Application session: This tab displays the metrics for all processes associated with the session. |
|
• |
Desktop session: This tab displays the metrics for the top consumers of system resources. You can configure the number of top processes that you want to display using the topN XenDesktop Agent property. |
If there are any processes that you do not want to monitor, you can add them to the Process Black List in the XenDeskTop Agent properties.
For more information about the topN and Process Black List agent properties, see Configuring XenDesktop Agent Process Configuration properties .
|
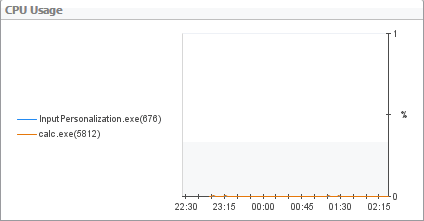
For each identified process, the CPU Usage chart displays the percentage of CPU resources used by the process during the selected time period. | ||
|
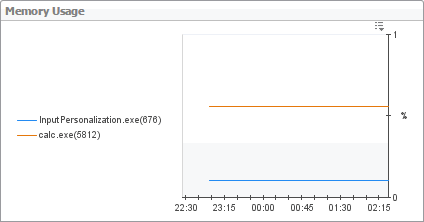
For each identified process, the Memory Usage chart displays the percentage of memory resources that are in use, during the selected time period. | ||
|
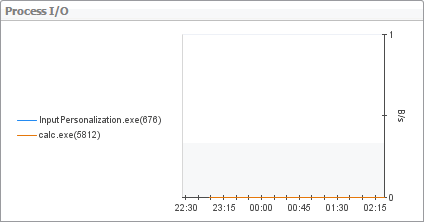
For each identified process, the Process I/O chart displays its data transfer rates, during the selected time period. | ||
|
For each identified process, the Page Faults chart displays the number of page faults encountered each second, during the selected time period. | ||
|
The percentage of memory resources the process currently uses. | ||
|
The number of page faults the process encounters per second. | ||
Monitoring Users
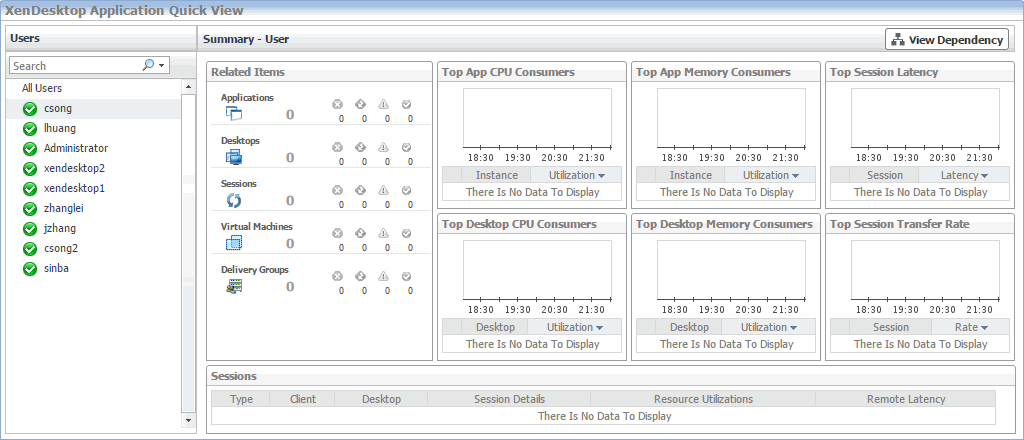
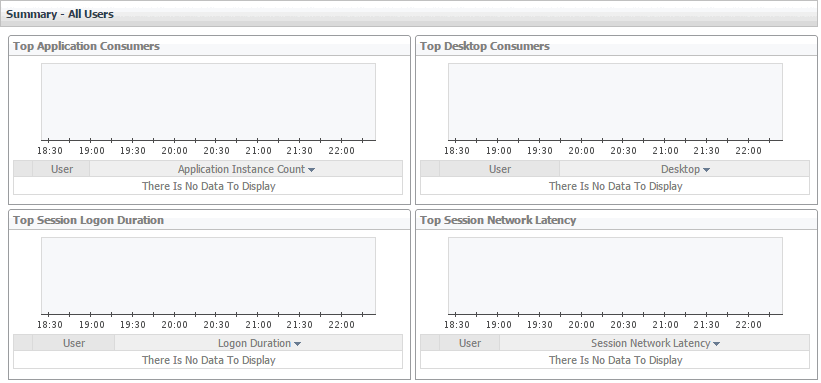
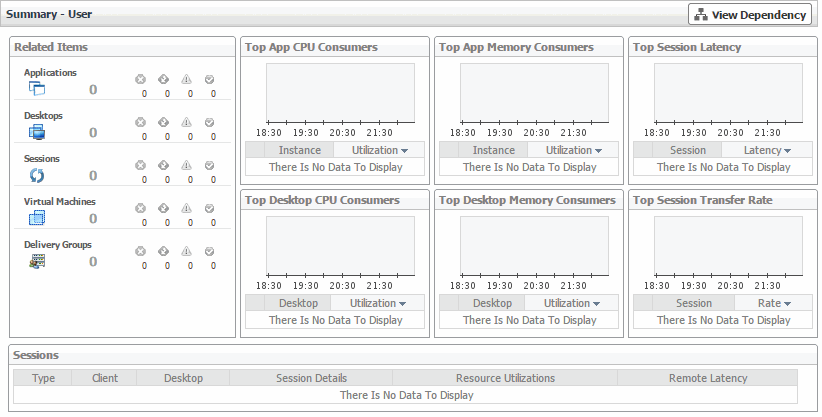
XenDesktop® facilitates delivery of application components to end users on demand. Foglight™ for Citrix XenDesktop and XenApp allows you to monitor the over utilization of resources associated with XenDesktop users. The information appearing in the XenDesktop User Quick View can help you discover potential resource-level issues that can be caused by higher than usual CPU or memory usage, or increasing latency and session rates, and to reallocate resources where they are most needed.
|
1 |
|
2 |
|
3 |
|
4 |
|
5 |

