
Updating a License
The Activate License dialog box lets you enter your new Metalogix Diagnostic Manager license key. You must have a valid license key equal to or greater than the number of SharePoint servers you want to monitor.
You may need to update a license when you increase the number of servers you want to monitor and you receive another license.
To update a license:
1.In the Management Console, choose Options > Settings> Options> Manage Licenses.
2.Click [Update license] to invoke the Activate License dialog.
3.In the Activate License dialog box, enter the license key.
4.Use the information in the following table to determine the appropriate option to use to activate the license.
|
If ... |
Then ... |
|---|---|
|
you want to activate the license online from the local machine |
click [Activate]. |
|
you want to activate the license online using a proxy |
a)Make sure the Use a proxy server to access Internet box is checked b)Click [Proxy Settings...]. c)Make sure the Proxy Settings dialog has been completed with the following information: §the Proxy Server name or IP address and Proxy Port or the Proxy Server url §the credentials to be used when connecting to the internet. d)To verify connection to the proxy server, click [Test]. e)Click [OK] to dismiss the dialog. |
|
you want to activate the license without internet access |
a)Switch to the Offline Activation tab. b)On the Activate License dialog, enter the license activation key. c)Follow the instructions that display in the dialog to complete the activation process: I.Collect the Activation Data. You have the option to either Copy Activation Data to Clipboard or Save Activation Data to (text) File. II.Submit collected data. Go to https://support.quest.com/offline-activation and follow the instructions for submitting your activation data. NOTE: When your activation key is returned, you have the option of copying it to the clipboard or saving it to a data file. Make sure that you choose the option to save to a data file as it is the only method that the Activate License dialog allows. III.Upload the Activation Key File obtained from to the Activate License dialog. IV.Click [Activate]. d)When the License activation succeeded message displays in the lower-left corner of the dialog, click [Close]. CAUTION: Installations using offline activation must be manually refreshed every 365 days. If you originally activated your Metalogix Diagnostic Manager license offline and it has been active for more than 365 days, when you launch the Management Console the splash screen may display a message that your license has expired. |
Connecting to the Collection Service
The Collection Service collects data from your SharePoint farms and Server Groups and stores it for the Management Console to access. You connect the Metalogix Diagnostic Manager Management Console to a Collection Service. The Management Console can connect to a single Collection Service at a time. If your network includes multiple Collection Services, you can connect to each in turn.
|
|
NOTE: If you run the Management Console on a computer that also hosts the Collection Service, then Management Console connects to the local Collection Service by default. You can manually select a different Collection Service. |

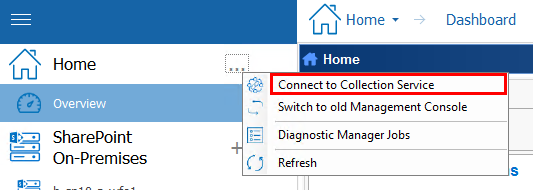
To connect to the Collection Service:
1In the Management Console ribbon, choose Home> ... > Connect to Collection Service.
2In the Connect to the Collection Service dialog box, type the name or IP Address of the computer that hosts the Collection Service.
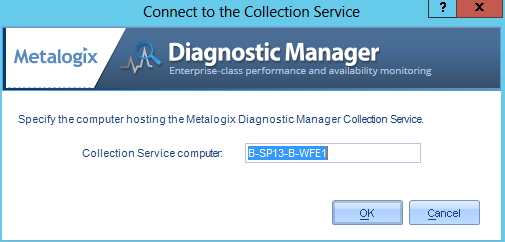
3Click OK.
Configuring Web Proxy Settings for Monitoring O365 Tenants and Web Pages
If you want to monitor O365 tenants and public Web pages from a machine that does not have Internet access or you want to use a secure connection, you can specify a proxy server to use for connecting to the Internet.
IMPORTANT: If you want to monitor an O365 tenant using a proxy, before you add the tenant to Metalogix Diagnostic Manager you must first configure the proxy in Internet Explorer. Otherwise, the message "Navigation to the Web page was canceled" will display when you attempt to add the tenant. Once the tenant has been successfully added, however, the proxy setting is no longer needed in Internet Explorer.
To configure web proxy settings:
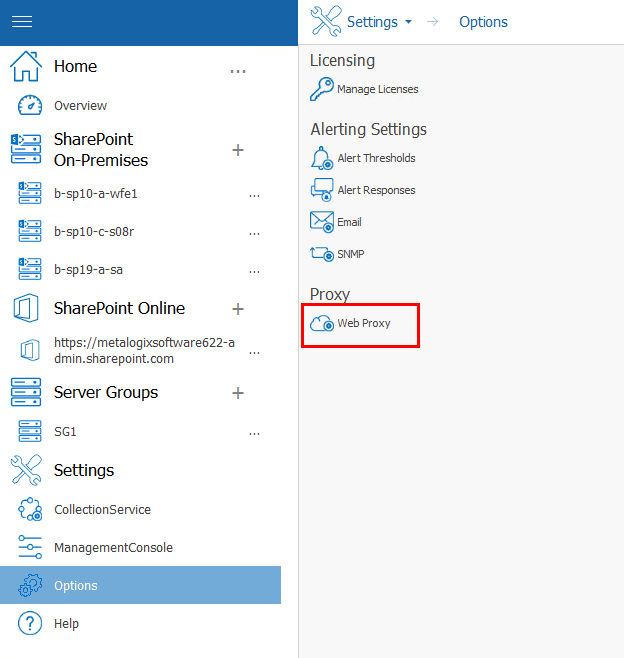
1.From the Management Console Options tab, click Web Proxy.
2.On the Proxy Settings dialog, make sure the Use proxy server to access Internet box is checked and the dialog has been completed with the following information:
§the Proxy Server name or IP address and Proxy Port or the Proxy Server url
§the credentials to be used when connecting to the internet.
3.To verify connection to the proxy server, click the [Test] button.
4.Click [OK] to dismiss the dialog.
Adding a Farm to Monitor
Metalogix Diagnostic Manager lets you monitor On-Premises SharePoint farms and/or Office 365 tenants. You first must add the farm to the Management Console before Metalogix Diagnostic Manager can provide you with data.
Before Adding a Farm to monitor:
Make sure the account(s) you will be using for data collection meet the requirements for Account(s) Used for Data Collection.
To add a farm to monitor:
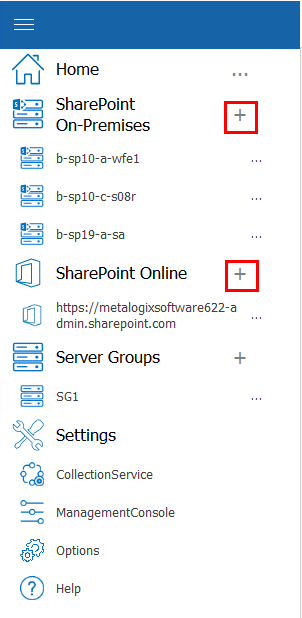
2In the Management Console tree, select the (+) beside "SharePoint On Premises" or "SharePoint Online" in order to add a farm to each respective category.
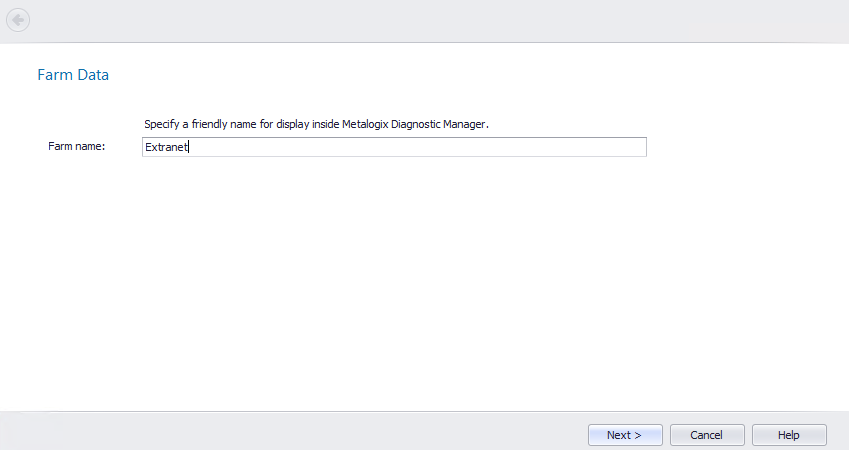
3For Farm name, enter a "friendly" name that you would like to have appear in the Management Console.
|
|
NOTE: This name appears only in Metalogix Diagnostic Manager and does not need to match any other name for the farm that is used outside the product. |
4Click [Next].
5Use the information in the following table to determine the appropriate action to take.
|
If you are adding ... |
Then ... |
|---|---|
|
a SharePoint On-Premises farm |
for Topology Server Data, enter the name or IP address of any Web front end Caution: The Collection Service contacts the server that you specify and uses information from the registry on the Topology Server to locate the SharePoint configuration database. The Collection Service then queries the configuration database to determine the servers that make up the farm and the roles the servers play. |
7Click [Next].
8Use the information in the following table to determine the appropriate action to take.
|
If you are adding ... |
Then ... |
|---|---|
|
a SharePoint On-Premises farm |
go to the next step. |
|
an Office 365 Tenant |
go to Step 10. |
9If you are adding a SharePoint On-Premises farm and want to collect data using credentials other than the Collection Service Account specified when the Collection Service was installed:
a)Check the appropriate option(s):
§Gather server performance data using WMI
§Query SharePoint database for farm topology and SQL Server information
§Test page performance and availability
b)Click [Next].
For each option you selected, you will be prompted to enter credentials for the alternate account.
c)Enter the User Name and Password for an account that has the appropriate permissions.
|
|
NOTE: Remember to enter the full account name (for example, domain\user name). |
If an account fails validation, an error message displays in the Account Test Results dialog.
If you want to copy the text of the message to the clip board, click [Copy]. You can then paste the information into another program. Click [OK] to dismiss the dialog, then fix the issue and re-enter credentials. When credentials have been successfully validated, click [Next].
10For Setup Your Alerts, either Apply default or select Apply custom and select/deselect individual alerts and/or adjust the thresholds that you want to apply for the farm.
|
|
NOTE: If you change the Alert priority, you can sort the Priority column in the Alerts view according to relative importance. |
11.Click [Next].
A Summary of the data you specified on the previous dialogs displays.
12If you are adding a SharePoint 2010, 2013, or 2016 On-Premises farm and want to Check server access and permissions for all servers in the farm, check this box. (This option is unavailable for SharePoint 2007 farms).
If you uncheck this box, the server access and permissions check will be skipped.
|
|
NOTE: You can perform this check at any time from within the Management Console using the Check Server Access option. |
If Check server access and permissions was selected on the Summary dialog, when you click [Next], the following information will display for each server in the farm:
·For a farm Topology server, access to the Config database connection string
·For each server in the farm:
§WMI access to
§Windows Registry, and
§Windows Services
·access to the master database of each SQL Server instance.
If the account fails any of the server access and permissions checks, you can fix the issue on the affected server(s) then [Run Checks Again].
12Click [Finish] to add the farm to the Management Console tree
The Collection Service stores the list of monitored farms in the Repository. Any user of the Management Console can add farms to the Collection Service or review any of the collected data.
|
|
NOTE: If you want to be able to collect component analysis data for the farm, remember to install the Component Analysis solution in the farm. Refer to the Metalogix Diagnostic Manager Advanced Installation Guide for details. |