Generating a SharePoint Summary Report
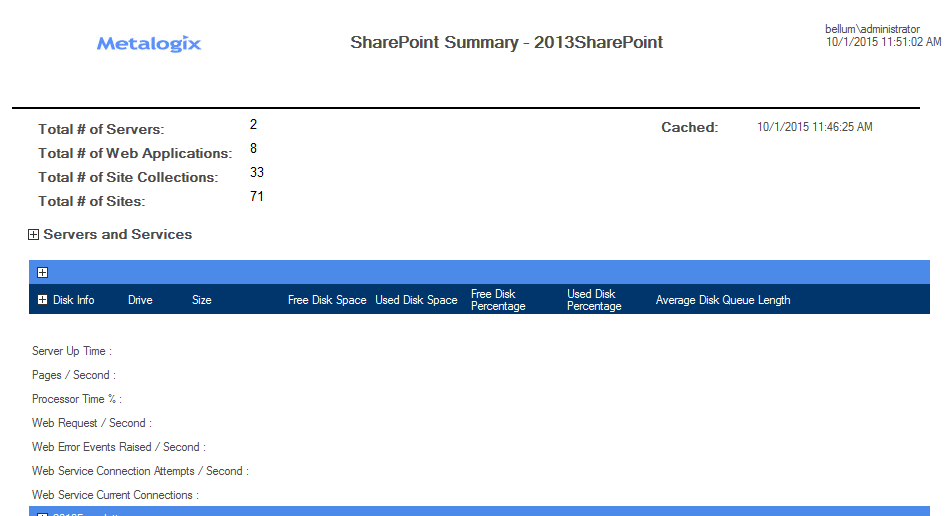
The SharePoint Summary report provides a comprehensive summary of the components (servers, services, Web applications, site collections, and sites) in the SharePoint farm currently being managed in ControlPoint, along with size and usage statistics.
You also have the option of including details about servers in your SharePoint farmsuch as storage, performance, and usage statisticswhich is collected from Windows Performance Monitor. This option can, however, significantly increase the time it takes to generate the report.
NOTE: For a server's details be included in report results, the ControlPoint Service account must have permissions to request status information from the server. Details can be found in the ControlPoint Administration Guide.
To generate a SharePoint Summary report:
1In the SharePoint Hierarchy, select the farm node, the choose SharePoint Summary.
2If different from the default values, specify the following parameters for your analysis:

§Select a View Activity for date or time period from the drop-down.
§If you want to Show Servers Details, check this box.
§If you do not want to Display expanded results, uncheck the box.
Now you can:
·run the operation immediately (by clicking the [Run Now] button)
OR
·schedule the operation to run at a later time or on a recurring basis.
OR
·save the operation as XML Instructions that can be run at a later time.
The SharePoint Summary consists of the following sections:
·a summary of farm components
·Servers and Services
·Web Applications
·Service Application Association (SharePoint 2010 farms only)
Farm Components Summary
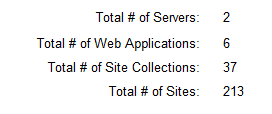
The top of the report displays the total number of servers, Web applications, site collections, and sites in the farm.
Note that the Total # of Sites includes root sites (whereas in the SharePoint Hierarchy, the number that displays in parentheses beside a site collection excludes the root site).
Servers and Services
If you chose to Show Servers Details, the Servers and Services section lists all of the servers in the farm, as well as all of the services currently installed on each server. Storage, performance, and usage details also display.
NOTE: Information reported varies, depending on the nature of the server. For example, Web Requests are not relevant for a SQL server. Depending on how WMI captures the information, if a statistic is irrelevant for the server, the value will display as either N/A or 0.
Web Applications
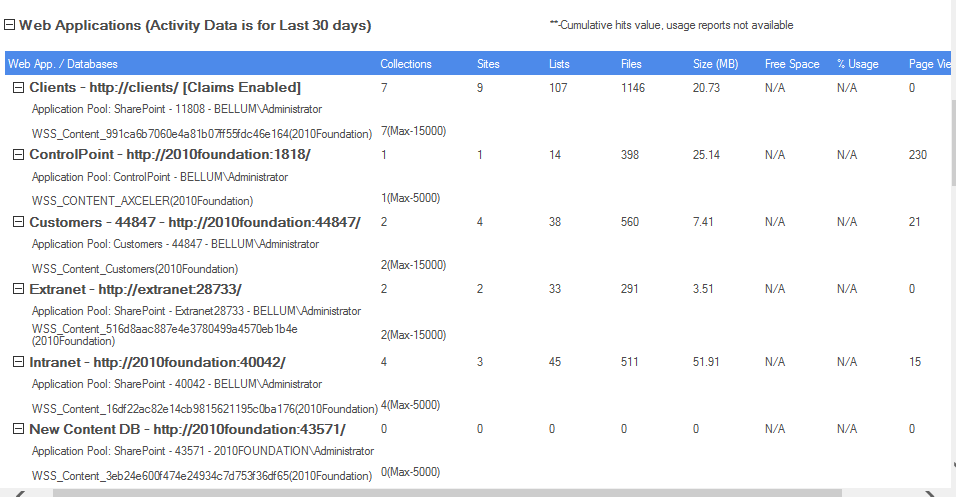
In addition to the Web application name and url, the Web Applications section displays the following statistics for each individual Web application, as well as aggregated totals for the entire farm:
·the number of:
§Site Collections
§Sites - which includes root sites and any subsites that have been created
§Lists - which includes both user-created (visible) lists and internal (hidden) lists, such as galleries, that are necessary for the functioning of the site, and
§Files - which includes web pages as well as documents
·Size, (in MB) - the total size of the Web application's content, which:
§does not include elements such as metadata, logs, free space, and other overhead
§is not the disk size of the content database
·If all site collections within a Web application have quotas:
§Free Space
§% Usage
NOTE: If there are site collections within a Web application that do not have quotas set, "N/A" will display in the Free Space and % Usage columns.
·Number of Requests for the specified date or date range.
When expanded, the following information about each Web application's content database(s) displays:
·the corresponding IIS application pool and the source account that runs the application pool
·the name of both the content database and the server on which it resides
·the current number of site collections in the database, and
·the maximum number of site collections allowed in the database.
Service Application Associations (SharePoint 2010)
If you are running SharePoint 2010, two additional sections are included in report results:
The Service Application Associations per Web Application section lists each Web application, along with the application Proxy Group to which it is mapped. When expanded, each Service Application associated with the Web application is listed along with its Status.
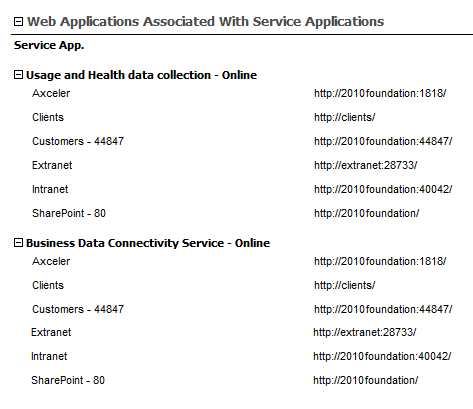
The Web Applications Associated With Service Applications section lists each of the Service Applications that have been associated with one or more Web applications. When expanded, all of the Web applications with which the Service Application is associated are listed.
Analyzing Activity
ControlPoint offers the following analysis tools that enable you to examine activity within your organization's SharePoint farm for a specific date or time period:
·Most/Least Activity analysis lets you examine site collections, sites, users, lists, and list items that have had the most and/or least activity over a specific time period
·Site Collection Activity Analysis provides detailed activity statistics for one or more site collections.
·Site Activity Analysis provides detailed activity statistics for one or more sites
·Activity by User analysis lets you examine specific pages and documents requested by one or more users.
·Activity by Document analysis lets you examine request detail for each page and document within one or more sites.
·Inactive Users analysis lets you find users who have had no activity for one or more site collections or sites over the past 30 days.
You can also analyze trends in activity over a specified time period. See Analyzing Trends.
NOTE: The nightly Full Discovery task accumulates and caches activity data that is collected by the nightly SharePoint Usage Analysis tasks. Therefore, activity data is as current as the last time the nightly Full Discovery task was run (that is, the option to run an activity analysis on real-time data is not available, and you cannot capture this data by running a manual (interactive) Discovery).
IMPORTANT: To generate a fully-functional Activity analysis:
Usage Data Collection must be used by all Web applications in the farm.
Variations in Activity Data
Variations in Site Usage Data
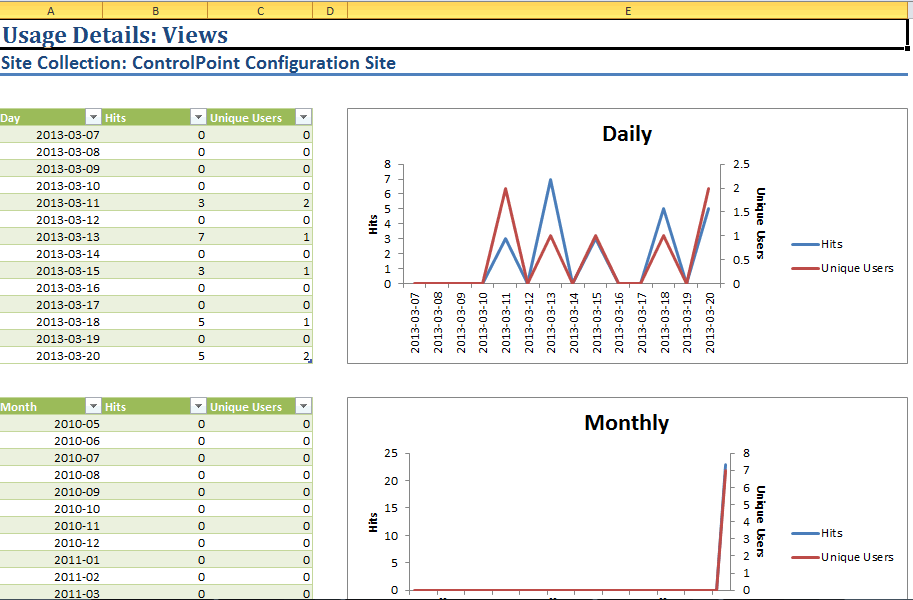
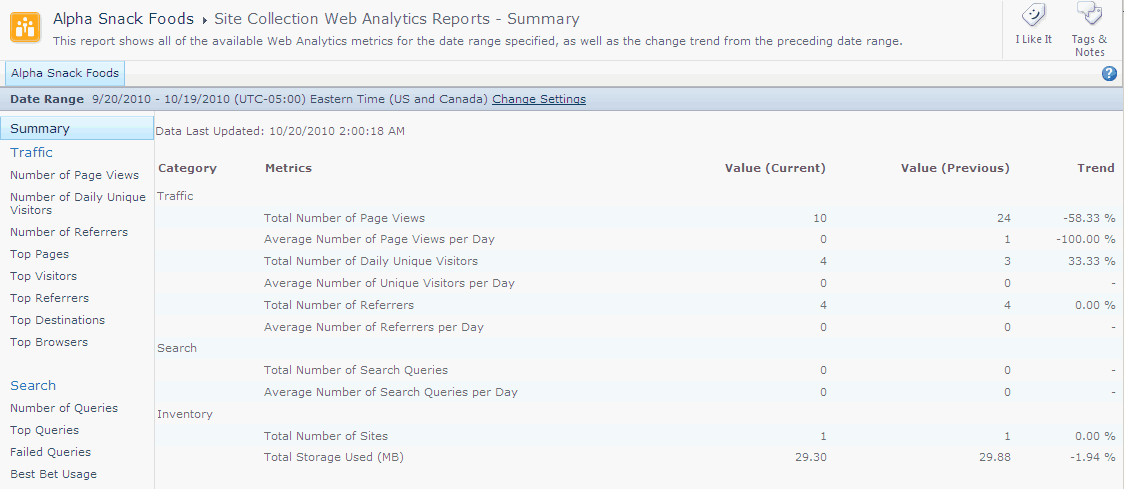
Typically, ControlPoint activity analysis data (including Farm Summary and Top Sites) is based on daily request data compiled by SharePoint.
At the site level, this data is normally presented:
·in a SharePoint 2013 and later environment, in various Usage and Search reports.
·in a SharePoint 2010 environment, in SharePoint Web Analytics reports.
You can link directly to the applicable page for your SharePoint environment from ControlPoint Activity Analysis results.
Depending on a number of factors, including the SharePoint variation that you are running and which features are activated in a particular site collection or site, the SharePoint site usage report data may be different from either of those shown in the example above.
For analyses that report cumulative monthly activity, data is collected from the SharePoint Search Service.
Analyzing Most/Least Activity
Use the ControlPoint Most/Least Activity analysis to examine SharePoint objects within a selected scope and specific date range, ranked according to:
·most or least active site collections and/or sites
·most or least active lists, list items, users, and/or pages.
You can further narrow your result set to include only objects that meet specific criteria and/or thresholds.
NOTE: The SharePoint Search Service is used to collect monthly data (up to 36 months by default but may vary depending on how the Search Service is configured). Because it does not use the Search Service, monthly activity is not available for SharePoint 2010.
To generate a Most/Least Activity analysis:
1Select the object(s) for which you want to analyze most/least activity.
2Choose Activity > Most/Least Activity.
3Specify the following parameters for your analysis:
a)Select the object types you want to analyze:
§Site Collections and Sites
OR
§Documents, Pages, and Users.
Note that remaining parameters are populated based on the object type selected.
b)If you selected Site Collections and Sites, Select either Show Daily Activity or Show Cumulative Monthly Activity
NOTE: If you selected Documents, Pages, and Users (or are using SharePoint 2010), you can only analyze daily activity and this option is unavailable.
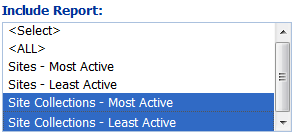
c)From the Include Report list box, select the type(s) of activity that you want to include in your analysis.
NOTE: If you choose multiple types of activity, each result set will be displayed in a separate subsection.
d)If you want results to cover a time period different than the default date range (for Daily, the past 30 days; for Monthly, from the beginning of the past month up to the current day of the current month), specify a different Start Date and/or End Date.
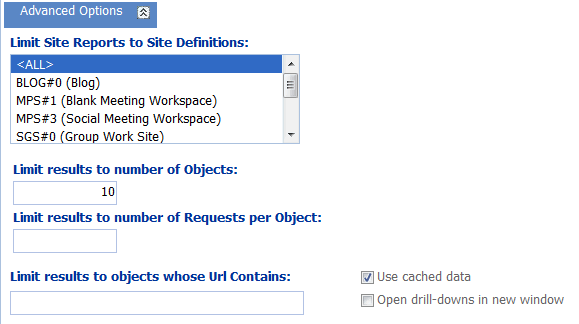
4If you want to further refine your results, expand the Advanced Options panel.
a)If you want to limit your result set to objects that meet one or more specific criteria, use the information in the following table for guidance.
|
If you want to limit each results set... |
Then ... |
|---|---|
|
to objects with one or more specific site definitions (templates) |
select from the Limit Site Reports to Site Definitions list. |
|
to more or less than 10 objects |
change the Limit results to number of Objects default value. NOTE: If this field is blank, the default value (10 objects) will be used. |
|
based on number of requests* |
enter a number for Number of Requests per Object. |
|
to objects whose url contains a specified text string |
enter that string in the Limit results to objects whose URL field. NOTE: If your analysis includes multiple activity types, this limit will apply to each individual result set. |
|
For Documents, Pages, and Users: | |
|
to lists of one or more specific list definitions |
select from the List Definitions list. |
|
to exclude lists that do not display in the site's View all Site Content page |
check the Omit Hidden Lists box. NOTE: If you choose to include hidden lists in analysis results, they are flagged in analysis results with a plus sign (+). |
|
based on number of items in a list* |
enter a number for Limit results to number of List Items per List. |
* NOTE: If your analysis includes "most" activity, results will include objects at or above that limit; for "least" activity, results will include objects at or below that limit.
b)If your analysis includes site collections, you have chosen to show Daily Activity, and you want to use usage data collected directly from SharePoint rather than the ControlPoint cache, uncheck the Use cached data box.
NOTE: Using cached data can significantly reduce the time it takes to generate an analysis on large site collections. Activity at other levels of the hierarchy is always performed in real-time.
Now you can:
·run the operation immediately (by clicking the [Run Now] button)
OR
·schedule the operation to run at a later time or on a recurring basis.
OR
·save the operation as XML Instructions that can be run at a later time.
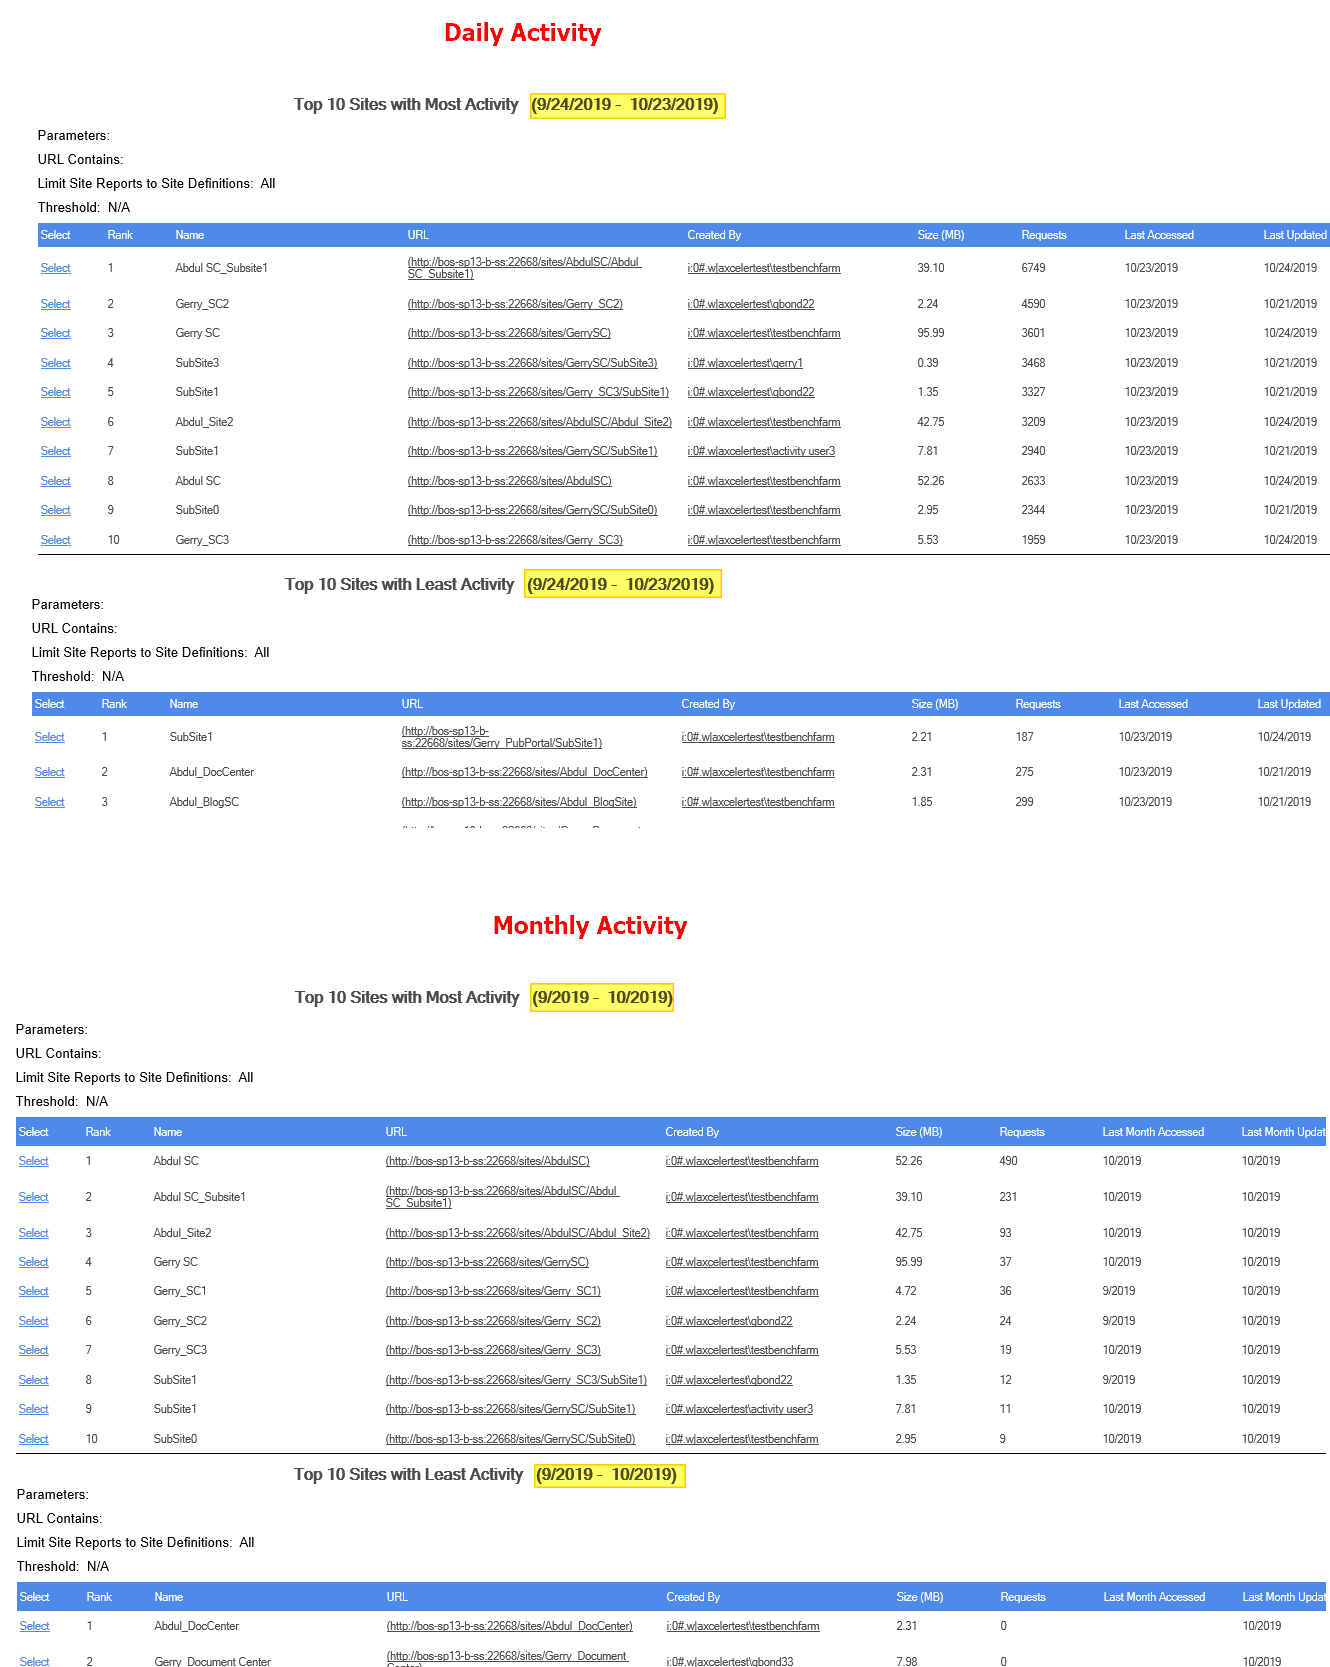
The body of the analysis includes a subsection for each usage type.
NOTE: For Daily activity, the Last Accessed date shows the last day the site was accessed within the date range covered by the analysis. For Monthly activity, the Last Accessed date shows the last month the site was accessedas far back as the earliest month in the SharePoint Search Services databaseregardless of the date range covered by the analysis.
Site Collections, Sites, or Users with No Activity
Note that if the number of site collections, sites, or users with no activity exceeds the value you specified for Limit Display to, a single line item with the total number with no activity will be returned rather than individual line items.
EXCEPTION: If your analysis includes Site Collections -Least Active and is run using cached (not realtime) data, results will show only site collections with the least amount of actual activity (site collections with no activity will not be included).
TIP: If you want to see all of the site collections, sites or users with no activity, generate another analysis with Limit Display to set to the number shown as the Inactive Count.

