Tchater maintenant avec le support
Tchattez avec un ingénieur du support

Foglight for Active Directory 5.7.2 - User and Reference Guide

Navigation basics Exploring Foglight for Active Directory dashboards Managing Active Directory agents Reporting on your Active Directory enterprise Foglight for Active Directory views
Forest views Domain views Site views Domain Controller views Description of embedded views
Address Book view Agent State view Asynchronous Thread Queue view Core Services view Database Access view Database Cache view Database Log Access view Database Performance Health view Defragmentation Tasks view DFS Namespace Service API Queue view DFS Namespace Service API Requests view DFS Namespace Service Referrals view DFS Replicated Folders view DFS Replication Connections view DFS Replication Service Volumes view DFS-R Performance Health view Directory Replication Inbound view Directory Replication Outbound view Directory Replication Sync view Directory Replication USN view Directory Services General view Directory Services Performance Health view Directory Services Reads view Directory Services Searches view Directory Services Writes view Domain Controller Details view Domain Controllers view FileReplicaConn Authentications/Bindings view FileReplicaConn Change Orders view FileReplicaConn Fetch view FileReplicaSet Authentications/Bindings view FileReplicaSet Change Orders view FileReplicaSet DS Communications view FileReplicaSet Files view FileReplicaSet Local Change Orders view FileReplicaSet Packets view FileReplicaSet Remote Change Orders view FRS Performance Health view FRS Replica Sets view FRS Staging Files view FSMO Roles view (Domain) FSMO Roles view (Forest) Host Monitor view Inter-Site Transports view Inventory By Category view IP Subnets view Key Distribution Center view LDAP view Memory view Network view Processor view Replication Performance Health view Resource Utilization view Security Accounts Manager view Server Health view Statistics view Storage view Summary and Resource Information view Top AD Metrics view Top 3 Consumers view Top 3 CPU Consumers view Top 3 DS Directory Reads/sec view Top 3 LDAP Bind Times view Top 3 Memory Consumers view Top 3 Network Consumers view Top 3 Replication Queue Length view Top 3 Storage Consumers view Trusts view USN Records view
Foglight for Active Directory rules Running diagnostic tests Managing Active Directory metrics

Accessing the Foglight for Active Directory dashboards

Click Active Directory Alarms to display a list of the current alarms triggered within Foglight for Active Directory.
Click Active Directory Environment to display the Active Directory Environment dashboard, which includes the following tabs:
Monitoring: displays a summary of the Active Directory® objects being monitored and their current state.
CA Health Check: displays a summary of the Certificate Authority servers being monitored.
Administration: allows you to perform administrative tasks, including:
Reports: allows you to build, view, and manage custom reports.
FAQTs: displays questions relating to a selected object.
Click Active Directory Explorer to display performance metrics and alarms for an Active Directory object type container or individual object.
Click Rule Management to view and manage Foglight for Active Directory rules.

Active Directory Alarms dashboard

The Active Directory Alarms dashboard shows the alarms that have been triggered but not cleared within Foglight for Active Directory. It can be used to isolate alarms specific to your Active Directory® environment.

The Alarms List displayed in the Active Directory Alarms dashboard is a sortable list that displays the outstanding Foglight for Active Directory alarms. Each alarm row in the Alarms List contains the following information.

Object

The icon in the first column identifies the source of the alarm:

Domain Controller

Domain

Forest

Site

General Active Directory® (not DC, Domain, Forest or Site)

Severity

The icon in this column indicates the severity of the alarm.

Server

Displays the name of the DC where the alarm occurred. Clicking the DC name displays a popup menu where you can choose to view details about the selected DC in either the Active Directory Explorer dashboard or Quick View.

Time

Displays the date and time when the alarm occurred.

Cleared

Displays whether the alarm was cleared.

Cleared By

For cleared alarms, displays the users who cleared the alarm.

Instance

Displays the name of the DC instance where the alarm occurred. Clicking the instance name displays a popup menu that provides health and alarm information for the selected instance.

Alarm Message

Displays the alarm message.

Clicking an alarm’s severity icon, object icon, alarm message or time displays a popup where you can acknowledge or clear the alarm. This popup provides pertinent information about the selected alarm, such as the rule of origin of the alarm, the history of the alarm, and all of the notes attached to the alarm. For more information about managing alarms, see the Foglight User Guide or online help.

Active Directory Environment dashboard

The Active Directory Environment dashboard includes the following tabs:

Monitoring: displays a summary of the Active Directory® objects being monitored and their current state. For details, see Active Directory Environment > Monitoring tab.
CA Health Check: displays a summary of the Certificate Authority objects being monitored.
Administration: allows you to perform administrative tasks, including:
Reports: allows you to manage custom Active Directory reports. For details, see Active Directory Environment > Reports tab.
FAQts: displays questions relating to a selected object. For details, see Active Directory Environment > FAQts tab.

Active Directory Environment > Monitoring tab

The Monitoring tab provides a summary of the Active Directory® components and consists of the following views:

The Active Directory Environment Overview is located across the top of the Active Directory Environment dashboard. It provides you with an overview of your Active Directory® environment.

The overview contains a tile for the following object types in your Active Directory infrastructure: forests, domains, sites, and domain controllers. Each tile shows the number of corresponding objects of that type in your Active Directory infrastructure as well as a count of objects of that type in each of the alarm states (fatal, critical, warning, and normal).

Clicking a tile displays summary information for that object type in the Quick View. Clicking an alarm state (for example, warning) on a tile displays summary information in the Quick View for the objects of that type that are in the selected alarm state.

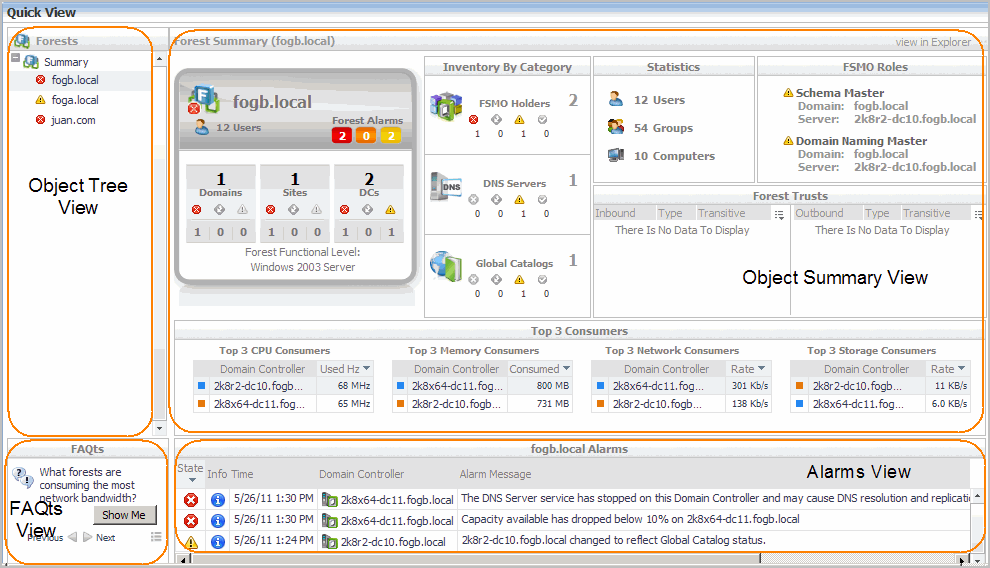
The Quick View is located across the middle of the Active Directory Environment dashboard.

Figure 8. Quick View

The Quick View displays summary information pertaining to the component selected from the Active Directory Environment Overview and Object Tree view. For example,

The Quick View consists of the following embedded views:

The Object Tree view is located at the left of the Quick View and displays objects based on the tile selected in the Active Directory Environment Overview. Use the Object Tree view to select a single object or a group of objects of a particular type for display in the Object Summary view.

The Object Summary view is located to the right of the Object Tree view and displays summary information for a single object or a group of objects, depending on what is selected in the Object Tree view.

The Object Summary view displays forest, server, site, and domain controller tiles (with the tile type reflecting the selected object type) or a number of embedded views which is determined by the item selected in the Active Directory Environment Overview and Object Tree view. A forest, server, site, or domain controller tile provides a quick and easy view into the items that make up the selected Active Directory® object and the alarm states of these items.

In addition, in the top right of the Overview Summary view there is a link to the Active Directory Explorer dashboard. This enables you to quickly navigate to the Active Directory Explorer for more detailed metrics about the selected object or group of objects.

The following table lists the information displayed when the different object tiles are selected.

Forests Tile

Summary

A forest tile for each forest in your Active Directory environment.

Forests Tile - Alarm Indicator

Summary

A forest tile for each forest in the selected state.

Forests Tile or Alarm Indicator

Forest Item

In addition to a forest tile for the selected forest, the following embedded views are displayed:

Domains Tile

Summary

A domain tile for each domain in your Active Directory environment.

Domains Tile - Alarm Indicator

Summary

A domain tile for each domain in the selected state.

Domains Tile or Alarm Indicator

Domain Item

In addition to a domain tile for the selected domain, the following embedded views are displayed:

Sites Tile

Summary

A site tile for each site in your Active Directory environment.

Sites Tile - Alarm Indicator

Summary

A site tile for each site in the selected state.

Sites Tile or Alarm Indicator

Site Item

In addition to a site tile for the selected site, the following embedded views are displayed:

Domain Controllers Tile

Summary

A domain controller tile for each DC in your Active Directory environment.

Domain Controllers Tile - Alarm Indicator

Summary

A domain controller tile for each DC in the selected state.

Domain Controllers Tile or Alarm Indicator

Domain Controller Item

In addition to a domain controller tile for the selected DC, the following embedded views are displayed:

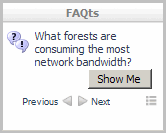
A FAQts view is displayed in the lower left corner of the Quick View on the Active Directory Environment dashboard and displays questions relating to the selected object. The questions in this view are scoped to the object tile selected in the Active Directory Environment Overview. For example, select the forest tile to view the questions about forests.

Figure 9. FAQts view

Use the Previous and Next buttons to scroll through the questions available for the selected object. Use the Show Me button to display the answer to the displayed question. Select the button to display a list of all relevant questions from which to select.

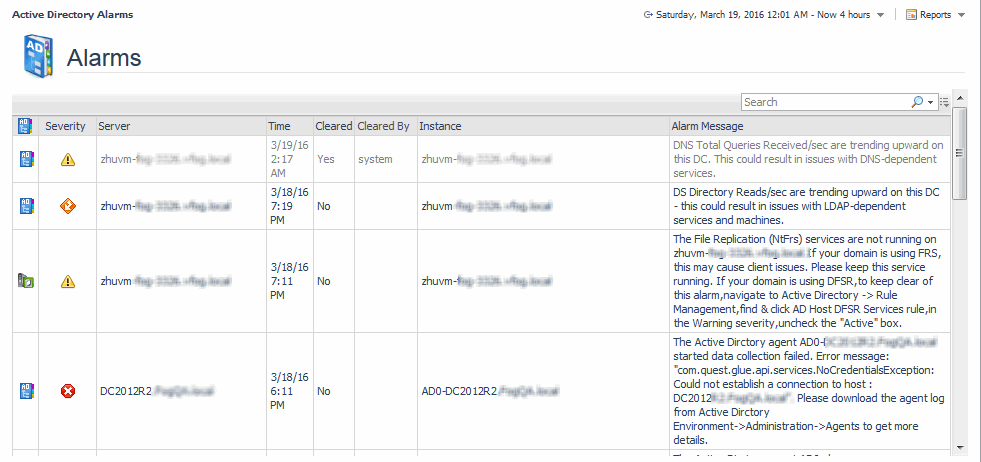
The Alarms view that appears at the bottom of the Quick View in the Active Directory Environment dashboard displays a sortable list of all the outstanding alarms for the item selected in the Object Tree view.

Documents connexes

The document was helpful.

Sélectionner une évaluation

I easily found the information I needed.

Sélectionner une évaluation