Tchater maintenant avec le support
Tchattez avec un ingénieur du support

Foglight for Active Directory 6.3.0 - User Guide

Navigation basics Exploring Foglight for Active Directory dashboards Managing Active Directory agents Reporting on your Active Directory enterprise Foglight for Active Directory views
Forest views Domain views Site views Domain Controller views Description of embedded views
Address Book view Agent State view Asynchronous Thread Queue view Core Services view Database Access view Database Cache view Database Log Access view Database Performance Health view Defragmentation Tasks view DFS Namespace Service API Queue view DFS Namespace Service API Requests view DFS Namespace Service Referrals view DFS Replicated Folders view DFS Replication Connections view DFS Replication Service Volumes view DFS-R Performance Health view Directory Replication Inbound view Directory Replication Outbound view Directory Replication Sync view Directory Replication USN view Directory Services General view Directory Services Performance Health view Directory Services Reads view Directory Services Searches view Directory Services Writes view Domain Controller Details view Domain Controllers view FileReplicaConn Authentications/Bindings view FileReplicaConn Change Orders view FileReplicaConn Fetch view FileReplicaSet Authentications/Bindings view FileReplicaSet Change Orders view FileReplicaSet DS Communications view FileReplicaSet Files view FileReplicaSet Local Change Orders view FileReplicaSet Packets view FileReplicaSet Remote Change Orders view FRS Performance Health view FRS Replica Sets view FRS Staging Files view FSMO Roles view (Domain) FSMO Roles view (Forest) Host Monitor view Inter-Site Transports view Inventory By Category view IP Subnets view Key Distribution Center view LDAP view Memory view Network view Processor view Replication Performance Health view Resource Utilization view Security Accounts Manager view Server Health view Statistics view Storage view Summary and Resource Information view Top AD Metrics view Top 3 Consumers view Top 3 CPU Consumers view Top 3 DS Directory Reads/sec view Top 3 LDAP Bind Times view Top 3 Memory Consumers view Top 3 Network Consumers view Top 3 Replication Queue Length view Top 3 Storage Consumers view Trusts view USN Records view
Foglight for Active Directory rules Running diagnostic tests Managing Active Directory metrics

Agent Status and Agent Properties dashboards

Similar to other cartridges, the Agent Status and Agent Properties dashboards allow you to edit an agent’s properties. Use the Data Collection Scheduler setting on these dashboards to modify the data collection schedule to be used to collect performance metrics.

Use the controls in this panel as described in the following table.

Active Directory Metrics Management dashboard

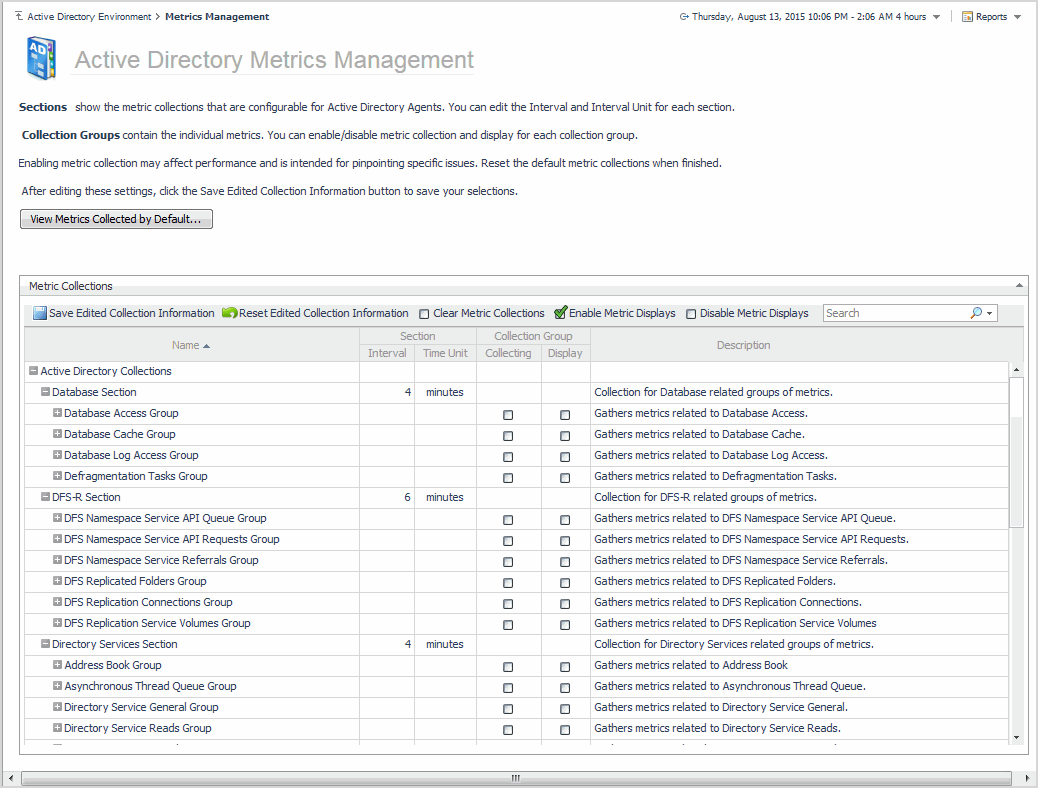
The Active Directory Metrics Management dashboard lists the metrics that can be optionally collected by an Active Directory® agent. Using this dashboard, you can enable these metrics to pinpoint specific performance issues or to modify the interval to be used to collect data.

The metrics displayed on the Active Directory Metrics Management dashboard are divided into the following components:

The Active Directory Metrics Management dashboard contains the following information for each collection metric.

Use the buttons on this dashboard as described in the following table.

Managing Active Directory metrics

You can only use the Metrics Management dashboard to enable or disable the collection and/or display of optional performance metrics. However, depending on the data collection schedule being used to collect metrics, you can use the Agent Status (agent properties page), Agent Properties or Metrics Management dashboard to modify a collection interval.

For details, see these topics:

Using the Metrics Management dashboard

Using the Active Directory Metrics Management dashboard, you can modify the interval and time unit for metric sections, enable/disable the collection of optional metrics in collection groups, or specify to display the collected metrics in a collection group.

To display this dashboard, select Active Directory Environment > Administration tab > Metrics Management from the dashboards listed in the navigation pane.

2
To change the interval, select the value displayed in the Interval column. Enter the new value in the dialog and select Update.
3
To change the time unit, select the value displayed in the Time Unit column. Select the new time unit (days, hours or minutes) in the dialog and select Update.
4
Select the Save Edited Collection Information toolbar button to save your selections.
2
Click the check box in the corresponding Collection Group | Collecting cell.
A green check mark is displayed in the Collection Group | Collecting column back on the Metrics Management page.
4
Click the check box in the corresponding Collection Group | Display column.
A green check mark is displayed in the Collection Group | Display column back on the Metrics Management page.
6
Select the Save Edited Collection Information toolbar button to save your selections.
7
On the Save dialog, click Save to confirm that you want to save your selection.
4
Select the Save Edited Collection Information toolbar button to save your selections.
5
On the Save dialog, click Save to confirm that you want disable the selected metric collection.
1
Documents connexes
Foglight for Active Directory - 6.3.0
Release Notes
Remote Access Diagnostics User Guide
User Guide
Showing 1 to 3 of 3 rows

The document was helpful.

Sélectionner une évaluation

I easily found the information I needed.

Sélectionner une évaluation