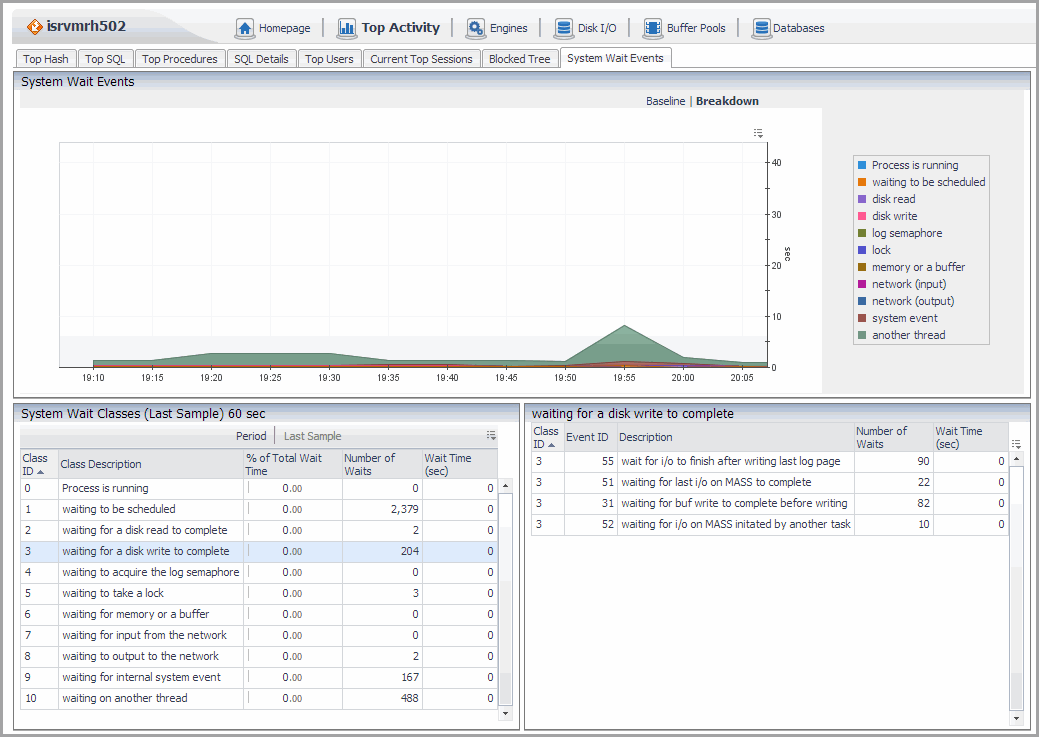
System Wait Events Tab
The System Wait Events tab information is provided in a chart and two tables:
 System Wait Events Tab
|
The following wait classes, plotted over time:
|
You can choose to display the system wait classes for either:
|
• |
The columns are common for both the Show Last Sample and Show Time Range tables.
You can view detailed information for a wait class by clicking a row in the System Wait Classes table. The detailed information appears in the Wait Events Details Table, located at the bottom-right of the screen at the next data refresh.
The content of this table is determined by the selection made in the System Wait Classes Table.
Spinlocks Tab
sp_configure "enable spinlock monitoring", 1
The dashboard shows the following type of objects in which ASE applies the spinlock mechanism:
|
• |
|
• |
For information about Data Caches Spinlock Contention, refer to the Buffer Pools Dashboard .
Execution Time Tab
|
• |
|
• |
|
Execution time, in microseconds, of each operation performed. | |
