Tchater maintenant avec le support
Tchattez avec un ingénieur du support

Foglight for SQL Server (Cartridge) 6.1.0.10 - User Guide

Introduction to this Guide Using Foglight for SQL Server
Viewing the Databases Dashboard Overview Dashboard Advisories Dashboard Monitoring Data Replication Monitoring SQL Performance Reviewing Memory Usage Reviewing the Instance Activity Reviewing Database Usage Reviewing the Services Using the HADR Drilldown Using the Logs Drilldown Reviewing Configuration Settings Viewing User-defined Performance Counters and Collections
Monitoring Business Intelligence Services Administering Foglight for SQL Server
Configuration Settings Managing Foglight for SQL Server Agent Settings Reviewing Foglight for SQL Server Alarms Generating Reports Monitoring SQL Server instances on VMware servers
Glossary
A
Access methods Adhoc SQL Plans Alarm Alert Allow updates Anonymous subscription Authentication AutoClose AutoGrow Automatic Discovery AutoShrink B Batch BCP (Bulk Copy Program) Blocking Books Online Bound trees Buffer Buffer cache Buffer pool Bulk copy Bulkinsert Bulk load C Cache CAL Calibration Cardinality Cartridge Chart Checkpoint process Client network utility CLR Compile Connect Connection Connectivity software CPU Usage Cursors D Data access components Data file Data storage engine Database Database object DataFlow DBCC DBID DBO Deadlock Disk queue length Disk transfer time Disk utilization DiskPerf Distributing instance Distributor DMO Drilldown DTC DTS E Error log Event alert Execution contexts Extended stored procedures Extent External procedures F File Filegroup File cache Foglight Agent Manager Foglight Management Server Foreign key Forwarded records Free buffers Free list Free pages Free potential Free space Freespace scans Full text search G GAM Ghosted records Growth increment GUID H Hash buckets Hashing Heap Hit rate Hit ratio Host name Host process I I/O Index Indid Integrated security Intent Locks J Job K Kernel memory Kernel mode Kill L Latch Lazy writer Licensing Lightweight pooling Lock Lock area Lock escalation Lock mode Log Log cache Log writer Logical I/O LRU LSN M Master MaxSize MDAC Metric Misc.normalized trees Model Monitor page file N Named pipes Net library NIC Null O OBID Object plans OLAP OLAP service OLTP Optimizer Optimizer cache osql P Page life expectancy Paging Panel Parse Parser Per seat licensing Per server licensing Performance alert Physical I/O Physical read Physical write PID Pinned Plan Plan cache Potential growth Prepared SQL plans Primary key Privileged mode Procedure cache Procedure plans Process Profiler Publication database Publisher Publisher databases Publishing server Pull subscription Pulse Push subscription Q Query plan R RAID Random I/O Read ahead Recompile Referential integrity Relational data engine Replication procedure plans Role Rollback S sa Schema locks Sequential I/O Session Severity SGAM Shared locks Show advanced options SMP Sort, Hash, Index Area SPID Spike Spinner SQL Agent Mail SQL Mail SQL Plans SQL Server Agent SQL Server authentication SQL Server books online Standard deviation Stolen pages Stored procedure Support service SYSADMIN role T TDS TempDB Temporary tables and table variables Threshold Torn page detection Transaction Trigger Trigger plans Truncate Trusted U UMS Unused space User connection area User mode V Virtual log file VLF W Waitfor Windows authentication mode Working set
Reference
SQL Performance Investigator Metrics
Active Time All SQL Agents CPU Usage All SQL Agents Resident Memory Usage Availability Average Physical I/O Operations Average SQL Response Time Backup Recovery Wait Blocked Lock Requests Checkpoint Pages CLR Wait CPU Usage CPU Wait Cursor Synchronization Wait Database Replication Wait Deferred Task Worker Wait Degree of Parallelism Disk Utilization DTC CPU Usage DTC Resident Memory Usage Distributed Transaction Wait Executions Ended Executions Started External Procedures Wait Full Scans Full Text Search CPU Usage Full Text Search Resident Memory Usage Full Text Search Wait Free Buffer Wait Hosted Components Wait IO Bulk Load Wait IO Completion Wait IO Data Page Wait IO Wait Latch Buffer Wait Latch Wait Latch Savepoint Wait Lazy Writes Lock Wait Lock Bulk Update Wait Lock Exclusive Wait Lock Intent Wait Lock Requests Lock Schema Wait Lock Shared Wait Lock Update Wait Lock Wait Log Buffer Wait Log Flushes Log Other Wait Log Synchronization Wait Log Wait Log Write Wait Memory Wait Network IO Wait Network IPC Wait Network Mirror Wait Network Wait Non SQL Server CPU Usage Non SQL Resident Memory Usage OLAP CPU Usage OLAP Resident Memory Usage OLEDB Provider Full Text Wait Other CPU Usage Other Miscellaneous Wait Other Wait Overall CPU Page Life Expectancy Page Splits Parallel Coordination Wait Physical I/O Physical Memory Used Physical Page Reads Physical Page Writes Probe Scans Plan Cache Hit Rate Range Scans Rec Ended Duration Remote Provider Wait Run Queue Length Samples Service Broker Wait Session Logons Session Logoffs SQL Agent CPU Usage SQL Agent Resident Memory Usage SQL Executions SQL Mail CPU Usage SQL Mail Resident Memory Usage SQL Recompilations SQL Response Time SQL Server Background CPU Usage SQL Server Cache Memory SQL Server Connections Memory SQL Server Connections Summary SQL Server Foreground CPU Usage SQL Server Resident Memory Usage SQL Server Swap Memory Usage Synchronous Task Wait Table Lock Escalation Target Instance Memory Total CPU Usage Total Instance Memory Virtual Memory Used
Rules Collections and Metrics
SQL Server Agent's Default Collections Access Methods Agent Alert List Agent Job List Always On Availability Groups Backup Locations Blocking History Blocking List Buffer Cache List Buffer Manager CLR Assemblies Cluster Summary Configuration Database Index Density Vectors Database Index Details Database Index Fragmentation Info Database Index Histogram Database Index List Database Information Database Properties Database Sessions (Session List) Database Summary Database Tables List Databases Deadlock DTC Information Error Log Error Log List Error Log Scan File Groups File Data Flow Statistics File Groups Files Files Drive Total Files Instance Summary Full Text Catalog InMemory OLTP (XTP) Instance Wait Categories Instance Wait Events Job Messages Latches and Locks Lock Statistics Locks List Log Shipping Log Shipping Error Logical Disks Long Running Session Memory Manager Mirroring Mirroring Performance Counters Missing Indexes Plan Cache Distribution Plan Cache List Replication Agents Replication Agent Session Actions Replication Agent Session Merge Articles Replication Agent Sessions Replication Agent Sessions by Type Replication Available Replication Publications Replication Subscriptions Reporting Services Resource Pool Session Data Session Trace SQL PI Instance Statistics SQL Server Connections Summary SQL Server Global Variables SQL Server Host SQL Server Load SQL Server Services SQL Server Throughput SQL Server Version Info SSIS OS Statistics SSIS Summary Statistics Top SQLs Top SQL Batch Text Top SQL Long Text Top SQL Plan Top SQL Short Text Top SQL Summary Traced SQL PA Usability User-defined Performance Counters User-defined Queries Virtualization XTP Session Transactions Statistics

Monitoring the disk storage

The Disk Storage pane displays the status of the storage devices in the SQL Server system, that is, databases and their backup, data files, and log files. Using this pane allows identifying storage issues such as a database that has not been backed up or a data file that has almost exhausted its growth potential and is going to fill completely.

In addition, the Disk Storage pane displays the Log Flush wait time alarm, which may indicate excessive I/O operation.

The total number of available databases in the SQL Server instance.

This icon displays an alarm when one or more of the databases becomes unavailable, or if any database has not been backed up in the last few days. For details about handling these alarms, see Recent Backups Alarm and Database Unavailable Alarm .

The total number of data files in all databases of the SQL Server instance.

The disk icon represents the total percentage of currently used space within the entire capacity of all data files that reside on all databases. The total percentage is also displayed in text at the bottom of this section, below the text that displays the physical size of data files space used.

The log files in all databases of the SQL Server instance.The total percentage is also displayed in text.

The percentage of time the busiest disk spent serving system-wide I/O requests.

The Disk Utilization metric serves as a measure for the system I/O load. High values may indicate a device bottleneck, due to either disk fragmentation or I/O resource contention of multiple processes that try to write or read from the disk.

The average number of I/O requests that are queued and waiting for an available disk during the sample interval. This figure may include I/O activity generated by both SQL Server and non-SQL Server processes. For details, see Viewing the disk queue length .

Monitoring Background Processes

The Background Processes pane displays the status of optional SQL Server components, such as the Replication Agent, which is implemented as a job of SQL Server Agent service, and several of the SQL Server services.

Some of the supporting services significantly enhance the database efficiency and accuracy, and therefore should be active at all times; for example, DTC, which ensures successful and complete transactions.

Indicates whether SQL Server Replication is configured. If replication is configured, indicates whether there are replication errors.

Replication is an optional component of SQL Server, which synchronizes data between different SQL Server databases.

Status of the SQL Server services that are currently monitored. These services are supplementary to SQL Server and provide capabilities such as mail and full text search.

This icon invokes an alarm when any of the SQL Server services are installed, but not active. For details, see Alarms Displayed in the Background Processes Panel .

For details about the drilldowns used for handling the supporting services alarms, see Reviewing the Support Service Status .

The SQL Server Physical I/O chart displays the rate at which pages are physically read from and written to disk by SQL Server. The read and write operations are carried out by either SQL Server processes or system processes.


Physical read operations are necessary when creating a table or an index page for the first time. Nevertheless, these operations should be avoided when possible, as requested pages should reside in the SQL Server buffer cache. High rates of these metrics indicate extensive data operations.

The following list presents the main physical I/O types shown in the chart:

Checkpoint Writes are the most common type of write activity under normal circumstances. The checkpoint process periodically scans the buffer cache for modified pages and flushes all modified pages out to disk, thereby minimizing the amount of work SQL Server is required to do on restart.
Lazy Writer Writes are carried out when the Lazy Writer process needs to free up buffer pages that have been modified in the buffer cache. Freeing up the buffers requires the Lazy Writer process to write first the changed pages to disk.
Physical Page Reads are carried out when a user connection requests a page that is not already in the buffer cache. The connection requesting the page awaits until the I/O operation completes.
Physical Page Writes are write operations where the user connection has to wait for the I/O to complete before continuing. These are most often caused by operations such as create index, bulk insert, or restore.
Read Ahead occurs when SQL Server forecasts the need for data that currently resides on the disk. In this case, the pages are pre-fetched into the buffer cache before being requested by the user, using Read Ahead processing.

The SQL Server Logical I/O chart displays the number of Logical reads (getpage requests) issued by SQL Server.

SQL Server keeps a copy of its most recently used database pages in the buffer cache. When a connection needs to reference a database page, SQL Server performs a Logical I/O operation by checking the buffer cache to see if the requested page is already in memory. If the page is found in the buffer cache, a Logical I/O read is carried out; otherwise, the page is read from disk, using a Physical I/O operation.

The Disk Queue Length chart displays the disk activity for each logical disk.

Disk Queue length tracks the average number of I/O requests that are queued and waiting for an available disk during the sample interval. This figure may include I/O activity generated by processes other than SQL Server. Values that exceed the threshold set in this metric may indicate a system bottleneck.

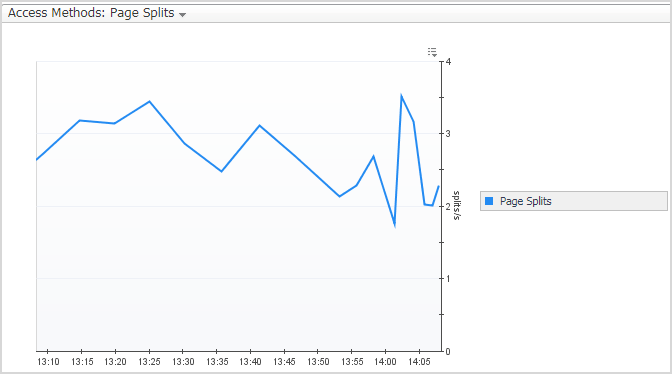
The Access Methods chart allows viewing various statistics used for monitoring the methods used for accessing and updating SQL Server data. These counters are all collected from the SQL Server Access Methods Manager.

Displays the rate at which index database pages are being split into two because the page does not contain enough free space to accommodate an inserted or updated record.

Displays the rate at which pages are being allocated to tables or indexes. Indicates how fast tables are expanding.

The rate at which pages are being de-allocated from tables or indexes, thereby indicating how fast tables are shrinking.

The number of scans initiated to search for free space to insert a new record. A high rate of freespace scans can indicate disk fragmentation.

The rate at which SQL Server is retrieving forwarded records.

When a row in a table that does not have a clustering index is updated - and if the modified row no longer fits on the old page - SQL Server moves the row to a new page and leaves a forwarding pointer in the old page.

Using this method saves the need to modify the non-clustered indexes in order to reflect the new row location; however, when this method is implemented, subsequent retrieval of this row using non-clustered indexes requires extra I/O resources.

A high Forwarded Records rate can indicate a need to reorganize the existing tables (unload/reload) or define clustered indexes.

The rate at which SQL Server encounters ghosted records during scans. When a record is deleted from a table, SQL Server improves concurrency by not physically removing the row from index Leaf levels, but marking it instead as deleted (ghosted).

At some later point, a housekeeping process asynchronously removes these rows from the leaf level. Until the records are removed, SQL Server must skip the ghosted records during leaf-level scans.

The rate at which locks are being escalated to the table level. A high table lock escalations rate may indicate a need to tune queries, in order to avoid designing multiple page locks that continually force SQL Server to carry out such escalations.

Viewing Session Details

The Sessions panel allows you to trace the activity of all currently opened sessions, as well as their resource consumption.

The Sessions panel is divided into 3 views:

The resource consumption section is divided into 2 time frames, Current and Last Hour.

The Current section allows viewing the consumption of various resources of all the sessions currently opened to the instance. The resource list is as follows:

Sessions — Displays the distribution of the currently opened SQL Server sessions between active (sessions that are actively processing in SQL Server) and inactive sessions during the current sampling period.
Throughput — Divided to 3 metrics which represent the throughput of the monitored instance:
Blocked — Displays the total number of SQL Server sessions that are blocked during the current sampling period.
CPU — The Host CPU Usage the total percentage of CPU resources being used on the monitored host. The displayed value represents the total CPU that is consumed by all Windows processes (SQL Server and non-SQL Server processes).

The Last 1 hour trend presents the activity on the instance during the last 1 Hour by presenting:

By clicking the All Wait Events link at the upper right corner of the section, The Active Wait Events pop-up appears, with the Resource drop-down list unfiltered and displaying the entire list of wait events

The current sessions view allows you to monitor the currently running sessions and their individual resource consumption. The Session List section contains a table that lists all currently running SQL Server sessions, displaying each session in a separate row. The Sessions view in the table can be filtered by the Active only and Foreground Only check boxes:

Allows termination of the selected session, using the Kill Session dialog box that is displayed upon clicking this column.

The session unique identifier (Session Process ID).

Indicates whether the session is active, blocked or suspended.

The SQL Server login name for this session.

The name of the database the user is accessing.

Time spent by the various sessions consuming CPU cycles. The CPU usage value is read directly from the operating system.

The portion, in megabytes, of the procedure cache allocated to this process. A negative number indicates that the process is freeing memory allocated by another process.

Sum of all the active wait events, equal to the session total activity within the current interval.

The number of open transactions. This parameter’s value corresponds to the value of the session’s @@trancount — a global variable that reflects the level of nested transactions.

The latest batch ran by this process.

The time when the session was created.

The program that is the owner of this SQL Server session.

The name of the client computer that established the SQL Server connection.

The time when the last batch started execution.

Which SPID (if any) holds locks on a resource on which this session is waiting.

The percentage, for this session, of buffer cache hit ratio, that is, file read operations that were satisfied by the file system cache without requiring any physical I/O. The value of this metric should be as high as possible.

The total number of data/index pages written to disk by the selected session

Normally SQL users do not have to wait for database write operations to complete. Most modifications to database pages are made in the buffer cache.

The total number of logical reads carried out by the selected session.

The total number of physical reads carried out by the selected session.

Indicates whether the session is active.

The context information of the current session.

The currently executed or most recently executed command.

The amount of time that this session will wait for lock requests to be satisfied; corresponds to the @@Lock_Timeout global variable for this session.

The amount of time since the session is started (dd:hh:mm:ss).

The name of the resource pool attached to the session

The number of In-Memory OLTP (XTP) open transactions by the session

The duration (in seconds) of the oldest transaction opened by the session

The refresh rate of the data displayed on the Sessions panel can be set by selecting a value from the Refresh interval drop-down list, which appears on the panel's upper right side.

The various sections of the Session Details page provide detailed information about the selected session upon selecting a specific session in the table.

Configuring SQL PI presents in-depth analysis of the session details. See Reviewing Session details with SQL PI

Session Process ID; the unique number that SQL Server has assigned to identify the selected session.

The time when the user logged on to the session.

Indicates whether the session is active or inactive.

The SQL Server login name for this session.

The name of the program the user is running to access SQL Server.

The name of the host the session is running from.

The resource on which the session is waiting.

The Workload page displays the selected session workload (Seconds/Sec) during the specified time range (default 1 Hr.). The breakdown displays the workload, distributed by the various wait event categories. The colors of the categories match the colors of the various resources displayed in the Resource Breakdown section. By clicking the All Wait Events link at the upper right corner of the section, The Active Wait Events pop-up appears, with the Resource drop-down list unfiltered and displaying the entire list of wait events.

Displays the sum amount f CPU (in seconds) that the selected session is consuming.

Displays the sum amount of IO (in pages) that the selected session is consuming.

The Session Details section contains several tabs of information.

This tab provides details about the statement that is currently being executed by the selected session.

The full text of the SQL execution batch.

Total CPU time consumed by the statement


The total number of physical I/O reads performed by the selected SQL statement.

The total number of physical I/O writes performed by the selected SQL statement.

Summary of all Sum of active wait events incurred by the SQL statement.

The total number of logical reads carried out by the selected SQL statement.

The resource on which the session is waiting.

Additional columns are displayed in the Metrics table when SQL PI is configured. See .

Time spent using CPU. Calculated in seconds.

Number of open transactions for the session.

Total number of physical reads operations performed by all requests running in the instance.

Total number of logical write operations performed by all requests running on the instance.

Total number of logical read operations performed by all requests running on the instance.

The ratio of logical reads to physical reads. It indicates the percentage of database page I/O requests that were satisfied from the Buffer Cache and therefore did not have to perform disk reads

Amount of memory

Sum of all the active waits and CPU usage, equal to the session total activity within the current interval.

The Session Trace pane uses SQL Server trace functionality to display the SQL events activity generated by the selected session. The retrieval of the data displayed in the Session Trace pane starts upon entering the pane, and retrieval continues throughout the session investigation run by Foglight for SQL Server. Two minutes after exiting the session pane, data retrieval for the specific session is automatically disabled.

Occurs when a remote procedure call (RPC) has completed

Occurs when a Transact-SQL batch has completed.

The type of class that was traced.

The time when the class event started.

The time when the class event ended.

The duration of the class event in milliseconds.

The query’s text. This column displays data only if the event class or classes being captured by the trace contain text.

The number of logical disk reads performed by the server on behalf of the event.

The number of physical disk writes performed by the server on behalf of the event.

The amount of CPU time (in milliseconds) used by the event.

ID of the database currently used by the session.

System-assigned ID of the object.

ID for the index on the object affected by the event.

The Session Blocks pane displays all blocks held or requested by the selected session. The Lock Status column indicates whether the locks have been granted to the session, or are currently blocked and waiting on another session.

The session unique identifier (Session Process ID). The unique number that SQL Server has assigned to identify the selected session.

The SQL Server login name for this session.

The type of the currently locked resource (Database, table, page, row, extent, and more).

The status of the lock, for example, running or blocked.

The time the session is waiting on lock.

The name of the currently locked object.

The currently executed command.

The name of the program the user is running to access SQL Server.

The Windows login name for this session.

The amount of CPU time, in milliseconds, used by the event.

The total number of I/O operations performed by the selected SQL statement.

The name of the host the session is running from.

The database on which the lock is taking place.

The full text of the SQL execution batch.

The Locks table displays information about all locks currently held or requested.

the server process ID of the current user process.

The database being used by the current process.

The number of locks of the type specified in the Lock Type column against the database specified in the Database column, from the SPID specified in the SPID column.

The index being used by the current process, if any.

The currently locked object.

The type of the resource that is currently locked. For example, database, table page, row, or extent.

The kind of lock being applied to the resource. For example, shared, exclusive, update, IntentShared, or IntentExclusive.

The status of the lock: Blocked, Blocking, or blank (Granted)

Configuring SQL PI enhances the Current session details by adding the next enhancements:

The SQL Summary pane displays summarized data about each of the SQL Statements that were executed by the session. The SQL statements are sorted into a table that represents the activity of each SQL statement that ran or still running on the selected session.

The SQL statement’s text.

Total CPU usage consumed by the statement.

Time spent by waiting in the systems run queue for CPU cycles. This reading is calculated from the operating system readings, rather than the SQL Server wait states.

Time spent waiting for disk input/output operations to complete.

Time spent waiting by the various processes waiting for the completion of a log operation.

Network wait events occur when a session spends time waiting for messages to be sent or received over the network interface.

Time spent waiting for a blocking lock, held by another session, to be released.

Time spent waiting for a Log operation to complete.

The number of seconds SQL Server has spent waiting for I/O operations on this file since the last time data was collected.

Time spent waiting for internal locks (latches) to be released.

Time spent waiting for CLR code execution to complete.

The time waiting for a remote OLEDB call to complete or DTS synchronization.

Time waiting for miscellaneous log waits.

The full text of the SQL execution batch.

The amount of time, in seconds, that the SQL statement’s execution lasted.

The total number of physical I/O reads performed by the selected SQL statement

The total number of physical I/O writes performed by the selected SQL statement.

The total number of logical reads carried out by the selected SQL statement.

The type of the command that was carried out by the selected SQL statement. For example, insert, select.

The Activity Panel displays the SQL Batch that is executed for the selected SQL statement in the table and a pie chart which display the SQL statement workload activity.

Selecting a metric row from the metric list present this metric activity in a chart. The data displayed in the chart represents the metric activity over the selected time frame.

Time spent waiting for backup or recovery tasks to complete.

The time spent synchronizing information flow within cursors.

Time spent waiting for replication synchronization events to complete.

Time spent waiting for I/O requests.

Time spent waiting for various distributed transaction events to complete.

Time spent waiting for external procedures to end.

Average CPU consumption by the Full Text Search service.

Time spent waiting for hosted components such as, but not exclusively, CLR.

Time spent waiting for the completion of I/O operations required to carry out a bulk load I/O.

Time spent waiting for I/O operations to complete.

Time spent waiting to latch a buffer for an I/O request.

Time spent waiting for latches that are not buffer latches or savepoint latches.

Time spent waiting to latch a buffer that is not an I/O request.

Time spent waiting to synchronize commits to marked transactions.

Time spent waiting to acquire bulk update locks.

Time spent waiting to acquire exclusive locks.

Time spent to acquire intent locks.

Time spent waiting to acquire schema locks

Time spent waiting to acquire shared locks.

Time spent waiting to acquire update locks.

Time spent waiting for space in the log buffer or otherwise waiting for memory to be made available to write log records.

Time spent waiting for miscellaneous log.

Time spent waiting to see whether log truncation frees log space.

Time spent waiting for outstanding I/O to finish, or waiting for log flushes to complete.

Time spent waiting for outstanding HTTP connections to complete and exit.

Time spent waiting for network packets.

Time spent waiting for sub-tasks to generate data; long waits are indicative of unexpected blockages.

Time spent waiting for sub-tasks to generate data; long waits are indicative of unexpected blockages.

Time spent waiting for the Microsoft Full Text Engine for SQL Server.

Time spent waiting for miscellaneous database operations.

Time spent waiting for parallel coordination tasks to complete.

Time spent waiting for Service Broker event handlers and endpoints.

Time spent waiting for tasks started synchronously. Most SQL Server processes are started Asynchronously.

Displays the same data as described in the Reviewing Session details with SQL PI .

The Sessions details can be sorted by selecting a resource from the drop down resource list above the left panel, by selecting the resource the workload chart will be updated accordingly.

Monitoring Locks and Latches

The Locks panel displays information about all locks and latches in the currently monitored SQL Server instance.The information is provided by the panes described in the following topics:

The Locks table displays information about all locks currently held or requested.

To configure the default retrieval settings for this panel, use the Lock view in the Databases Administration dashboard. For details, see Setting Options for Displaying Data in the Locks Panel .

Table 30. The Locks table displays the following columns:

The server process ID of the current user process.

The database being used by the current process.

The number of locks of the type specified in the Lock Type column against the database specified in the Database column, from the SPID specified in the SPID column.

The index being used by the current process (if any).

The currently locked object.

The type of the resource that is currently locked (Database, Table, Page, Row, Extent, and so on).

The kind of lock being applied to the resource (Shared, Exclusive, Update, IntentShared, IntenExclusive, and so on).

The status of the lock: Blocked, Blocking, or blank (Granted).

SQL Server login name for this session.

The Lock Types chart shows lock statistics broken down by the various types of locks available in SQL Server.

This chart displays one line for each of the following lock types:

Use the list on the chart title to select which of the following lock types to display:

Waits — the rate of lock request wait events. Such wait events take place when lock requests cannot be satisfied immediately and require the caller to wait before being granted the lock.
Average Wait Time — the average time (in seconds) that elapses before a lock request wait is cleared.
Lock Requests — the number of lock requests and lock conversion requests per second.
Timeouts — the number of lock time-outs per second.
Deadlocks — the number of lock requests per second that resulted in a deadlock.

The Latches chart displays statistics on latch requests.

This chart shows the following series of data:

Latch Waits — how many wait events for latches occurred in the specified time range
Total Wait Time — the total amount of time (in milliseconds) that latch requests spent waiting during the specified time range

Latches are file system locks, used for synchronizing data within SQL Server. Latches are enforced when a data element is being accessed physically, in order to ensure that the data page on which the data element resides is readable and writable.

Enforcement of latches is also carried out before the modified data page is written to disk, to prevent modifications by other users during the physical write operation. After the page is successfully written to disk, the latch is released.

A high rate of latch wait events per second may indicate a slow disk I/O subsystem.

Documents connexes

The document was helpful.

Sélectionner une évaluation

I easily found the information I needed.

Sélectionner une évaluation