
Introduction to this Guide
Installation
About Monitoring Extensions
Installing and Monitoring a Single SQL Server Instance
Discovering Multiple Instances to Monitor
Using Foglight for SQL Server
Adding instances manually
Discovering instances by host name
Discovering instances by IP range
Importing Instances from a File
Configuring Multiple Instances for Monitoring using Silent Installation
Viewing the Databases Dashboard
Monitoring Business Intelligence Services
Assigning Instances to Users or Groups
Selecting an Instance to Monitor
Overview Dashboard
Advisories Dashboard
Monitoring Data Replication
Monitoring SQL Performance
Currently Selected Database Group
Filtering the Display by Severity
Creating Custom Database Groups
Previewing the Requested Instance
Components Shared by all Foglight for SQL Server Screens
Foglight for SQL Server Toolbar and Views
Resource Toolbar Options
Monitoring SQL Performance without SQL PI configured
Monitoring SQL Performance with SQL PI Configured
Reviewing Memory Usage
Viewing the Memory Summary
Monitoring Buffer Cache-related Data
Reviewing the Instance Activity
Reviewing the Top-consuming Objects of the Buffer Cache
Tracking the Page Allocations
Monitoring the Buffer Cache Hit Rates
Monitoring Plan Cache-related Data
Reviewing Object Types
Monitoring the Plan Cache
Tracking Memory Allocation to the Plan Cache by Object Type
Reviewing Statistics about Plan Cache Objects
Viewing In-depth Data about the Instance
Reviewing Database Usage
Reviewing the Services
Reviewing the SQL Server Instance Activity
Viewing the SQL Server I/O activity
Viewing SQL I/O Activity Data
Overview Dashboard
Identifying the Instance
Tracking the Instance Data Flow
Monitoring General Session Statistics
Tracking logical reads
Tracking compiles
Monitoring the SQL memory management
Tracking physical I/O activity
Monitoring the disk storage
Monitoring Background Processes
Viewing Session Details
Monitoring Locks and Latches
Tracking Current Lock Conflicts
Tracking Deadlocks and their Affected Objects
Viewing I/O Statistics by Database Files
Reviewing the Support Service Status
Reviewing SQL Agent Jobs
Viewing SQL Agent Alerts
Monitoring SQL Server Transactions using the DTC Panel
Monitoring Full-text Indexes using the Full Text Search Panel
Using the HADR Drilldown
Monitoring the Log Shipping
Monitoring Cluster Services
Tracking the Status of the Mirroring Operation
Using the Logs Drilldown
Reviewing Configuration Settings
Viewing User-defined Performance Counters and Collections
Mirroring Table
Viewing the Role and Data Flow of the Selected Database
Viewing the Selected Database's Mirroring Performance History
Viewing the Partner's Mirroring Page
Reviewing the Always On Availability Groups
Permissions
Monitoring Integration Services
Monitoring Reporting Services
Monitoring Analysis Services
Administering Foglight for SQL Server
Configuring Analysis Services Monitoring
Overview dashboard
Unprocessed Objects Dashboard
Current Activity Dashboard
Monitoring Analysis Service Performance
Resource Toolbar Options
Performance Tree
Viewing Historical Metrics
Viewing Change Tracking
BI Administration Settings
Configuration Settings
Managing Foglight for SQL Server Agent Settings
Glossary
Opening the Databases Administration Dashboard
Reviewing the Administration Settings
Defining Connection Details
Customizing Alarms for Foglight for SQL Server Rules
Reviewing Foglight for SQL Server Alarms
Introducing the Alarms View
Viewing Alarm Sensitivity Levels for Unassigned Agents
Modifying Alarm Templates
Configuring Email Notifications
Cloning Agent Settings
Reviewing Rule Definitions
Defining Data Collection and Storage Options
Defining Error Log Filtering
Configuring Performance Counters
Setting Options for Displaying Data in the Buffer Cache
Setting Options for Displaying Data in the Plan Cache
Setting Options for Displaying Data in the Locks Panel
Defining Retention Policies
Defining the Collection and Display of Top SQL Statements
Defining the Collection of Database Indexes
Configuring User-defined Collections
Administering SQL Performance Investigator
Configuring the On-demand Data Settings
Configuring the Database to be Excluded
Alarms Displayed in the SQL Processes Panel
Alarms Displayed in the SQL Memory Panel
Alarms Displayed in the Background Processes Panel
Alarms Displayed in the Database Details Panel
Generating Reports
Monitoring SQL Server instances on VMware servers
A
Reference
Access methods
Adhoc SQL Plans
Alarm
Alert
Allow updates
Anonymous subscription
Authentication
AutoClose
AutoGrow
Automatic Discovery
AutoShrink
B
Batch
BCP (Bulk Copy Program)
Blocking
Books Online
Bound trees
Buffer
Buffer cache
Buffer pool
Bulk copy
Bulkinsert
Bulk load
C
Cache
CAL
Calibration
Cardinality
Cartridge
Chart
Checkpoint process
Client network utility
CLR
Compile
Connect
Connection
Connectivity software
CPU Usage
Cursors
D
Data access components
Data file
Data storage engine
Database
Database object
DataFlow
DBCC
DBID
DBO
Deadlock
Disk queue length
Disk transfer time
Disk utilization
DiskPerf
Distributing instance
Distributor
DMO
Drilldown
DTC
DTS
E
Error log
Event alert
Execution contexts
Extended stored procedures
Extent
External procedures
F
File
Filegroup
File cache
Foglight Agent Manager
Foglight Management Server
Foreign key
Forwarded records
Free buffers
Free list
Free pages
Free potential
Free space
Freespace scans
Full text search
G
GAM
Ghosted records
Growth increment
GUID
H
Hash buckets
Hashing
Heap
Hit rate
Hit ratio
Host name
Host process
I
I/O
Index
Indid
Integrated security
Intent Locks
J
Job
K
Kernel memory
Kernel mode
Kill
L
Latch
Lazy writer
Licensing
Lightweight pooling
Lock
Lock area
Lock escalation
Lock mode
Log
Log cache
Log writer
Logical I/O
LRU
LSN
M
Master
MaxSize
MDAC
Metric
Misc.normalized trees
Model
Monitor page file
N
Named pipes
Net library
NIC
Null
O
OBID
Object plans
OLAP
OLAP service
OLTP
Optimizer
Optimizer cache
osql
P
Page life expectancy
Paging
Panel
Parse
Parser
Per seat licensing
Per server licensing
Performance alert
Physical I/O
Physical read
Physical write
PID
Pinned
Plan
Plan cache
Potential growth
Prepared SQL plans
Primary key
Privileged mode
Procedure cache
Procedure plans
Process
Profiler
Publication database
Publisher
Publisher databases
Publishing server
Pull subscription
Pulse
Push subscription
Q
Query plan
R
RAID
Random I/O
Read ahead
Recompile
Referential integrity
Relational data engine
Replication procedure plans
Role
Rollback
S
sa
Schema locks
Sequential I/O
Session
Severity
SGAM
Shared locks
Show advanced options
SMP
Sort, Hash, Index Area
SPID
Spike
Spinner
SQL Agent Mail
SQL Mail
SQL Plans
SQL Server Agent
SQL Server authentication
SQL Server books online
Standard deviation
Stolen pages
Stored procedure
Support service
SYSADMIN role
T
TDS
TempDB
Temporary tables and table variables
Threshold
Torn page detection
Transaction
Trigger
Trigger plans
Truncate
Trusted
U
UMS
Unused space
User connection area
User mode
V
Virtual log file
VLF
W
Waitfor
Windows authentication mode
Working set
SQL Performance Investigator Metrics
Active Time
All SQL Agents CPU Usage
All SQL Agents Resident Memory Usage
Availability
Average Physical I/O Operations
Average SQL Response Time
Backup Recovery Wait
Blocked Lock Requests
Checkpoint Pages
CLR Wait
CPU Usage
CPU Wait
Cursor Synchronization Wait
Database Replication Wait
Deferred Task Worker Wait
Degree of Parallelism
Disk Utilization
DTC CPU Usage
DTC Resident Memory Usage
Distributed Transaction Wait
Executions Ended
Executions Started
External Procedures Wait
Full Scans
Full Text Search CPU Usage
Full Text Search Resident Memory Usage
Full Text Search Wait
Free Buffer Wait
Hosted Components Wait
IO Bulk Load Wait
IO Completion Wait
IO Data Page Wait
IO Wait
Latch Buffer Wait
Latch Wait
Latch Savepoint Wait
Lazy Writes
Lock Wait
Lock Bulk Update Wait
Lock Exclusive Wait
Lock Intent Wait
Lock Requests
Lock Schema Wait
Lock Shared Wait
Lock Update Wait
Lock Wait
Log Buffer Wait
Log Flushes
Log Other Wait
Log Synchronization Wait
Log Wait
Log Write Wait
Memory Wait
Network IO Wait
Network IPC Wait
Network Mirror Wait
Network Wait
Non SQL Server CPU Usage
Non SQL Resident Memory Usage
OLAP CPU Usage
OLAP Resident Memory Usage
OLEDB Provider Full Text Wait
Other CPU Usage
Other Miscellaneous Wait
Other Wait
Overall CPU
Page Life Expectancy
Page Splits
Parallel Coordination Wait
Physical I/O
Physical Memory Used
Physical Page Reads
Physical Page Writes
Probe Scans
Plan Cache Hit Rate
Range Scans
Rec Ended Duration
Remote Provider Wait
Run Queue Length
Samples
Service Broker Wait
Session Logons
Session Logoffs
SQL Agent CPU Usage
SQL Agent Resident Memory Usage
SQL Executions
SQL Mail CPU Usage
SQL Mail Resident Memory Usage
SQL Recompilations
SQL Response Time
SQL Server Background CPU Usage
SQL Server Cache Memory
SQL Server Connections Memory
SQL Server Connections Summary
SQL Server Foreground CPU Usage
SQL Server Resident Memory Usage
SQL Server Swap Memory Usage
Synchronous Task Wait
Table Lock Escalation
Target Instance Memory
Total CPU Usage
Total Instance Memory
Virtual Memory Used
Rules
Collections and Metrics
SQL Server Agent's Default Collections
Access Methods
Agent Alert List
Agent Job List
Always On
Availability Groups
Backup Locations
Blocking History
Blocking List
Buffer Cache List
Buffer Manager
CLR Assemblies
Cluster Summary
Configuration
Database Index Density Vectors
Database Index Details
Database Index Fragmentation Info
Database Index Histogram
Database Index List
Database Information
Database Properties
Database Sessions (Session List)
Database Summary
Database Tables List
Databases
Deadlock
DTC Information
Error Log
Error Log List
Error Log Scan
File Groups
File Data Flow Statistics
File Groups
Files
Files Drive Total
Files Instance Summary
Full Text Catalog
InMemory OLTP (XTP)
Instance Wait Categories
Instance Wait Events
Job Messages
Latches and Locks
Lock Statistics
Locks List
Log Shipping
Log Shipping Error
Logical Disks
Long Running Session
Memory Manager
Mirroring
Mirroring Performance Counters
Missing Indexes
Plan Cache Distribution
Plan Cache List
Replication Agents
Replication Agent Session Actions
Replication Agent Session Merge Articles
Replication Agent Sessions
Replication Agent Sessions by Type
Replication Available
Replication Publications
Replication Subscriptions
Reporting Services
Resource Pool
Session Data
Session Trace
SQL PI Instance Statistics
SQL Server Connections Summary
SQL Server Global Variables
SQL Server Host
SQL Server Load
SQL Server Services
SQL Server Throughput
SQL Server Version Info
SSIS OS Statistics
SSIS Summary
Statistics
Top SQLs
Top SQL Batch Text
Top SQL Long Text
Top SQL Plan
Top SQL Short Text
Top SQL Summary
Traced SQL PA
Usability
User-defined Performance Counters
User-defined Queries
Virtualization
XTP Session Transactions Statistics
Configuring Multiple Instances for Monitoring using Silent Installation
|
1 |
|
3 |
|
• |
README.txt file |
|
• |
mssql_cli_installer.groovy — a groovy script file that runs the silent installation. This file should be copied to the <FMS_HOME>/bin directory. |
|
• |
silent_installer_input_template.csv — a template file that should serve as the basis for inserting contents into the input CSV file. This file can be copied to any folder of your choice, if the path indicated by the <csv_instances_file_name> parameter (see below) points to the selected path. For details about the contents of this file, see Contents of the Input CSV File . |
|
• |
MSSQLPermissionsCheck.sql — this file contains the SQL that the user should run on the monitored instance to check permissions needed for monitoring |
|
• |
MSSQLPermissionsGrant.sql — this file contains the SQL that the user should run on the monitored instance in order to grant the instance the required permissions for monitoring. |
|
5 |
Copy the mssql_cli_installer.groovy file to the <FMS_HOME>/bin directory. |
|
6 |
Go to the command line and run the command: <FMS_HOME>/bin/fglcmd -srv <fms_host_name> -port <fms_url_port> -usr <fms_user_name> -pwd <fms_user_password> -cmd script:run -f mssql_cli_installer.groovy fglam_name <fglam_name> instances_file_name <csv_instances_file_name> lockbox_name <lockbox_name> lockbox_password <lockbox_password> |
|
• |
A file with the input file's name and _status suffix (for example: if the input file is named input, this file is named **input_new_-_**). |
The _status file includes the name of the monitored Foglight for SQL Server agent, the result of the monitoring validation process — MONITORED, FAILED, or AGENT EXISTS — and the error message, in case the agent creation failed.
|
• |
A file with input file's name and _new suffix (for example: if the input file is named input, this file is named input_status). |
Using this CSV file, the user only needs to fix the errors and re-run the script, this time by specifying this file as the input file, that is: the original filename with suffix _new. In the example used here, the new file should be named input_new_new.csv.
Contents of the Input CSV File
The input CSV file contains the following fields, which are used as columns in the resulting file:
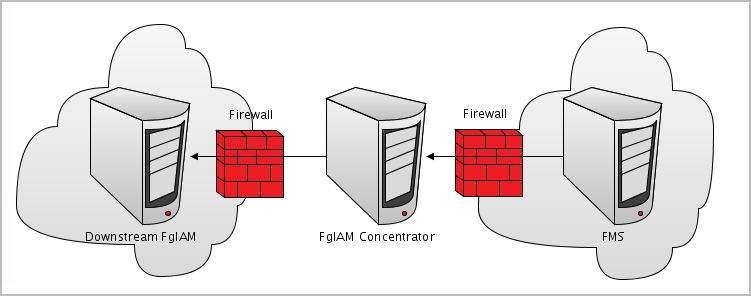
Configuring the On Demand Data Port on the Agent Manager Concentrator
|
1 |
|
2 |
Click Create Agent. |
|
3 |
Select the agent type DB_SQL_Server_Concentrator. |
|
5 |
Click Create. |
|
2 |
Click Edit Properties. |
|
3 |
Click Modify properties for this agent only. |
|
6 |
Click Edit to edit the list of downstream Agent Managers. |
|
7 |
Click Add Row. |
|
IMPORTANT: When editing the properties of the Foglight Agent Manager concentrator (Dashboards > Administration > Agents > Agent Status), the name of the Foglight Agent Manager should be entered in the Downstream FglAMs section exactly as it appears in the topology, under Home > Agents > All agents > <Agent name> > RMI data > FglAM host property. The <Agent name> parameter refers to the Foglight for SQL Server agents that reside on the selected Foglight Agent Manager. |
|
10 |
Click Save Changes. |
|
11 |
Click Save at the lower right corner of the screen. |
|
12 |
Click Back to Agent Status. |
|
14 |
Click Activate. |
|
15 |
Click OK to complete the process. |