By default, the Alert Log panel displays all of the alert log messages.
The Alert Log panel comprises the panes described in the following topics:
|
• |
|
• |
|
• |
The Alert Log Messages table provides the following details about each alert log:
|
• |
|
• |
|
• |
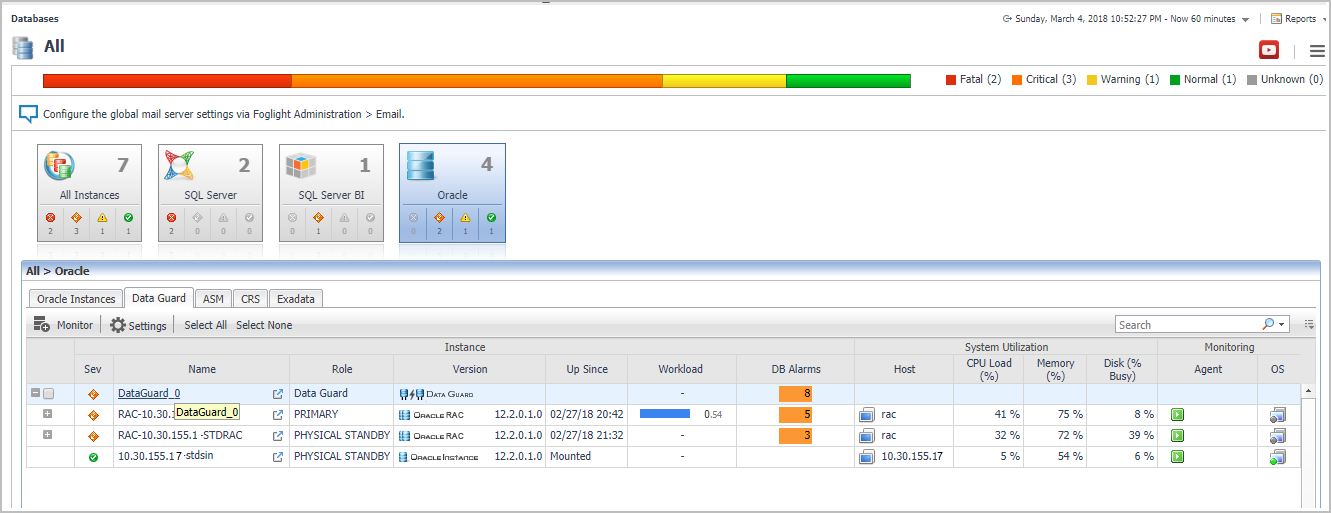
The Data Guard dashboard has three tabs:
The Performance tab displays the following charts:
|
a |
|
a |
|
• |
|
a |