1. View, Acknowledge, and Clear Recent Alarms: Navigates to the Alarms dashboard. You can use this dashboard to view the state of all alarms across the entire Foglight installation so you can take immediate action on them. You can also use this dashboard to identify alarm storms or outage events by viewing the alarm count by time. See the User Guide for more information.
2. View Enterprise Health Organized by Monitoring Domain: Takes you to the Domains dashboard, from which you can view an end-to-end, top-level summary of all domains in the Domains dashboard and drill down to view their managed instances. See the User Guide for more information.
3. View the Health of Critical Services: Causes the Service Operations Console to appear. In the Service Operations Console, you can choose a group of services as a focal point for your monitoring. See Service Operations Console and the User Guide for more information.
4. View the Health of the Monitored Hosts in Your Enterprise: Takes you to the Hosts dashboard. Navigate to the Hosts dashboard if you want to view host-related alarms and a high-level summary of performance on your monitored hosts. See Hosts dashboard and the User Guide for more information.
5. Report on Your Enterprise: Causes the Reports dashboard to appear. Use this dashboard to view reports that are scheduled, run a report using a report template, create a custom report, schedule a report to run at a specific time, and manage reports. See the User Guide for more information.
6. Tap into the Foglight Community: Takes you to the Foglight Community (https://www.quest.com/community/products), where you can read blogs about Foglight and participate in discussions.
This section provides an introduction to the Foglight Administrator’s version of the Welcome page. For details about this page, see the Administration and Configuration Guide.
1. View Your Enterprise Health: The View Your Enterprise Health page provides links to dashboards that allow you to observe the overall health of your system by viewing existing alarms and the state of your domains, services, and monitored hosts. See the Administration and Configuration Guide for more information.
2. Configure Alarm Reporting and Blackouts: Takes you to the Configure Alarm Reporting and Blackouts page, which contains additional links to the dashboards that show more details about the current email and blackout setup. Use these pages to configure Foglight to send alarm-related email using your email server and to suspend alarms and data collection. See the Administration and Configuration Guide for more information.
3. Report on Your Enterprise: Takes you to the Reports dashboard, from which you can view reports that are scheduled, run a report using a report template, create a custom report, schedule a report to run at a specific time, and manage reports. See the User Guide for more information.
4. Do More with Foglight: Opens the Do More With Foglight page. This page provides links to dashboards that provide more details about each aspect of your system health. Use these dashboards to define your own custom services, quickly build dashboards, view agent status, and perform other administrative functions. See the Administration and Configuration Guide for more information.
5. Tap Into the Foglight Community: Takes you to the Foglight Community (https://www.quest.com/community/products), where you can read blogs about Foglight and participate in discussions.
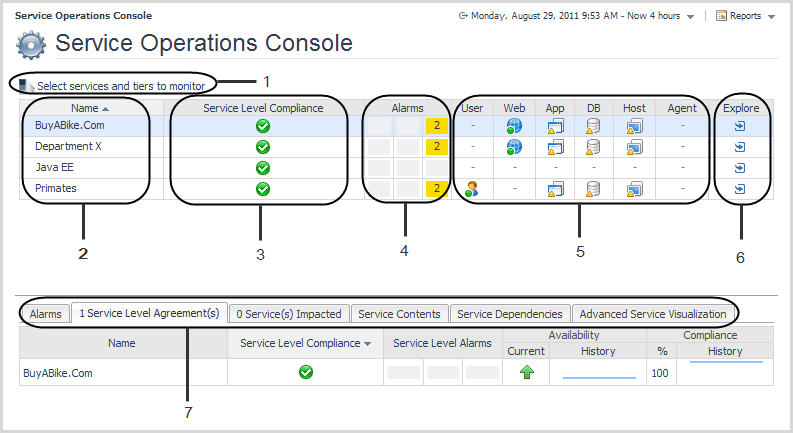
This section provides an introduction to the Services Operations Console dashboard. For details about this dashboard and services, see “Monitoring your services” in the Foglight User Guide.
1. Select services and tiers to monitor link: Opens the Select services and tiers to monitor dialog box, which you use to select the services and tiers that interest you. Selecting services and tiers causes them to appear in the Service Operations Console dashboard. See the User Guide for details.
2. Name column: Lists the services that you select. See the User Guide for more information about services.
3. Service Level Compliance column: Shows the service level for each service. Foglight automatically creates a service level for each service. The level of compliance is determined by the component in the most severe state. See the User Guide for more information.
|
TIP: Click an icon in this column to display a popup with more information about the Service Level Agreement for the service. Follow the Explore > Service Level Agreement(s) link in the popup to navigate to the Service Levels dashboard populated with information specific to that service. See the online help for the Service Levels dashboard for details. |
4. Alarms column: Shows the number of alarms for the services that you select. Clicking one of the icons in this column causes an Outstanding Alarm(s) view to appear with a list of alarms specific to that service.
5. Tier columns: Show performance information for the tiers you chose to display. Tiers help you structure services in a way that represents your monitored environment. By default, Foglight organizes data into tiers such as User, Web, Application, Database, Host, and Agent. See the User Guide for more information. The icons in each column show the aggregate state of that tier for that category or service. A tier’s state is determined by the most severe state of its monitored components, including related hosts.
6. Explore column: Opens the Service Details view for the selected service. The Service Details view provides a breakdown of monitored components, related agents, and their associated outstanding alarms. See the User Guide for details.
7. Service Operations Console tabs: Display details for the selected category or service, such as its contents and dependencies. See the User Guide for details.
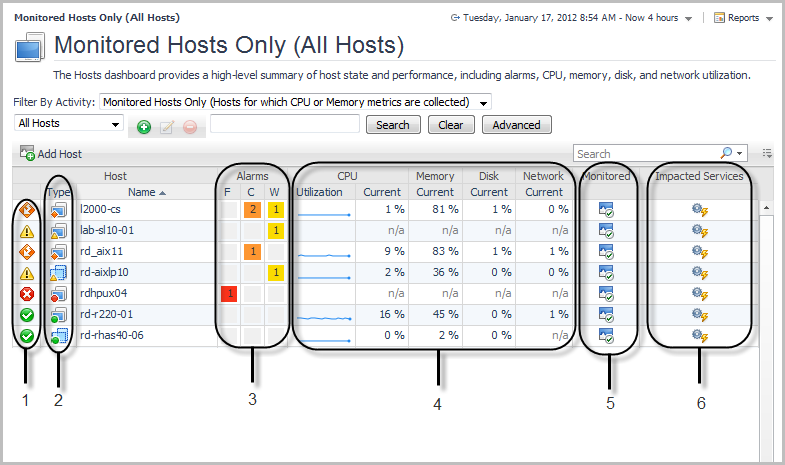
1. State indicators: Allow you to see the state of your hosts at a glance. Each state indicator shows the aggregate alarm state of the host, which is determined by the host’s most severe alarm. In this dashboard, the indicator represents a state rollup from the host and its children, excluding the state of agents on that host.
2. Type icons: Identify the host as physical or virtual: physical hosts are identified by the icon , VMWare images by the icon
, and ESX® servers by the icon
.
3. Alarms column: Shows the number of alarms for each host. To investigate alarms, click an icon in this column to display a view with a list of alarms for that host. See “Viewing, acknowledging, and clearing alarms” in the User Guide for information about working with alarms.
4. CPU, Memory, Disk, and Network columns: Each column displays recent and current values for that metric category, allowing you to obtain a concise overview of CPU-, memory-, disk-, and network-related performance for each host. The values displayed in the sparkline change with the dashboard’s time range. By default, a sparkline is shown only in the CPU Utilization column. See “Viewing a host’s performance” in the User Guide for more information.
5. Monitored column: Identifies whether or not the host is configured for monitoring. If the host is not monitored, click the icon to launch a popup that lets you configure monitoring. If the host is monitored, clicking the icon opens the Agent List popup.
6. Impacted Services icons: Launch a popup that helps you establish whether critical services are affected by problems with one of your hosts. See “Seeing if a host’s state impacts your services” in the User Guide for details.