Expanding your collection of monitored network devices
This assumes that you already have the agent package deployed to the Foglight Agent Manager host, and one or more active Net Monitor Agent instances are in place. For complete information on how to deploy an agent package, and how to create and activate agent instances, see the Administration and Configuration Help.
|
2 |
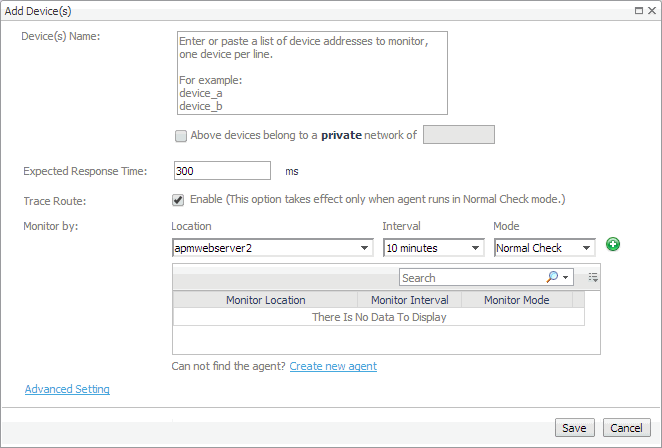
In the Add Device(s) dialog box, provide information about the network device that you want to monitor. |
|
• |
Device(s) Name: Type the names of one or more network devices that you want to monitor. This can be a host name or a host IP address. If a host name is specified, Foglight Net Monitor resolves it using DNS. |
|
• |
Above devices belong to a private network of: If the hosts on which these devices are installed belong to a private network, select this check box and type the network name. |
|
• |
Expected Response Time. Specify the expected amount of round-trip response time in milliseconds between the monitored location and the network device. |
|
• |
Trace Route (Enable): Select this check box if you want to trace the route from the monitoring station to the device. If you do not select this option, you can execute a trace route in real time on the Trace Route page. For more information, see Tracing data packets between monitoring locations and network devices. |
|
• |
Monitor by: Specify one or more rules for collecting information about the monitored devices. |
|
• |
Advanced Settings: To specify advanced settings such as the device name override, the number of packets to ping, the packet size when pinging, ping timeout, or trace route timeout, click Advanced Settings and override the default values, as required. |
|
3 |
Removing network devices from the existing collection
|
2 |
Click Yes to confirm the removal and close the message box. |
|
3 |
Click OK to close it. |
Viewing and editing individual network device details
|
2 |
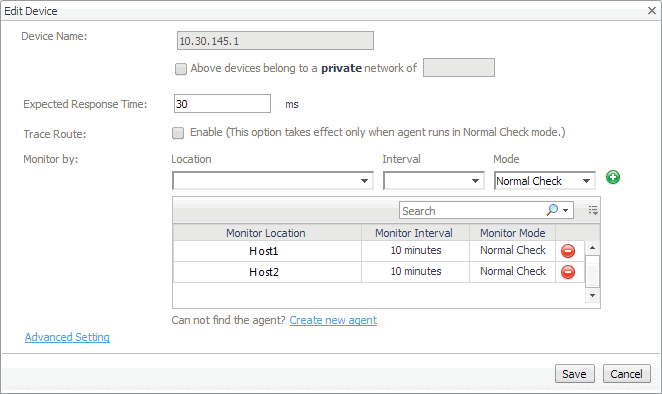
In the Edit Device dialog box, review the device settings, and make any changes, as required. |
|
• |
Device Name: Type the names of one or more network devices that you want to monitor. This can be a host name or a host IP address. If a host name is specified, Foglight Net Monitor resolves it using DNS. |
|
• |
Above devices belong to a private network of: If the hosts on which these devices are installed belong to a private network, select this check box and type the network name. |
|
• |
Expected Response Time. Specify the expected amount of round-trip response time in milliseconds between the monitored location and the network device. |
|
• |
Trace Route (Enable): Select this check box if you want to trace the route from the monitor station to the device. If you do not select this option, you can execute a trace route in real time on the Trace Route page. For more information, see Tracing data packets between monitoring locations and network devices. |
|
• |
Monitor by: Specify one or more rules for collecting information about the monitored devices. |
|
• |
Advanced Settings: To specify advanced settings such as the device name override, the number of packets to ping, the packet size when pinging, ping timeout, or trace route timeout, click Advanced Settings and override the default values, as required. |
|
3 |
Investigating the performance of network devices
You can access this dashboard from the navigation panel. Under Dashboards, click Infrastructure > NetMonitor > Performance Browser.
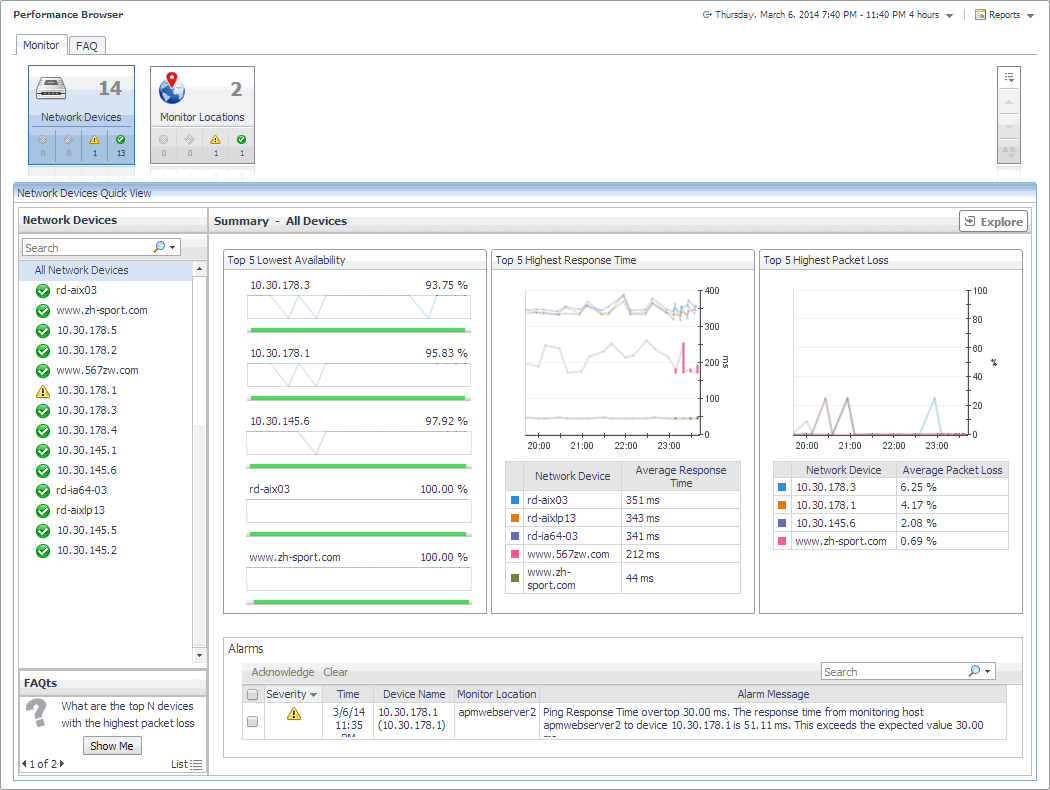
When you navigate to the Performance Browser for the first time, the Monitoring tab appears open. This tab provides an overall summary of your monitored network devices.
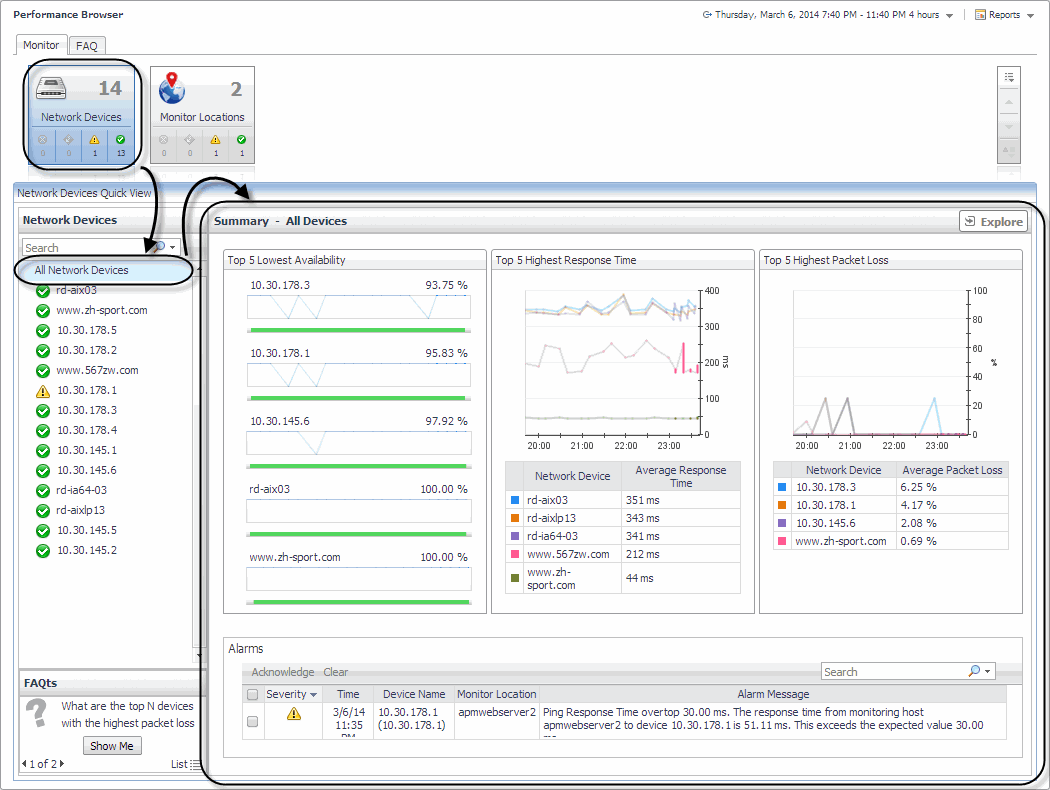
Start by indicating the type of objects that you want to investigate. To do that, select the appropriate tile at the top of the Monitoring tab: Network Devices or Monitor Locations. This causes the Quick View to display information about the selected objects. Next, select an object or group of objects in the Quick View, such as All Network Devices or All Monitor Locations, to display additional information about that selection.
For complete details about the views appearing on this dashboard, see Net Monitor Performance Browser views.


