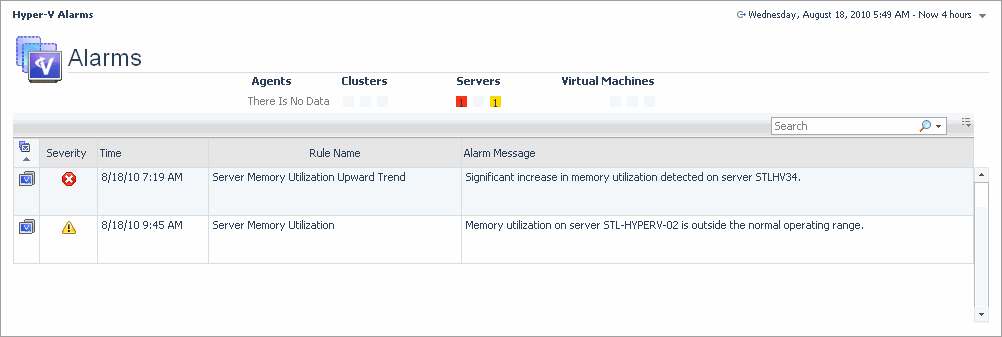
Alarm table
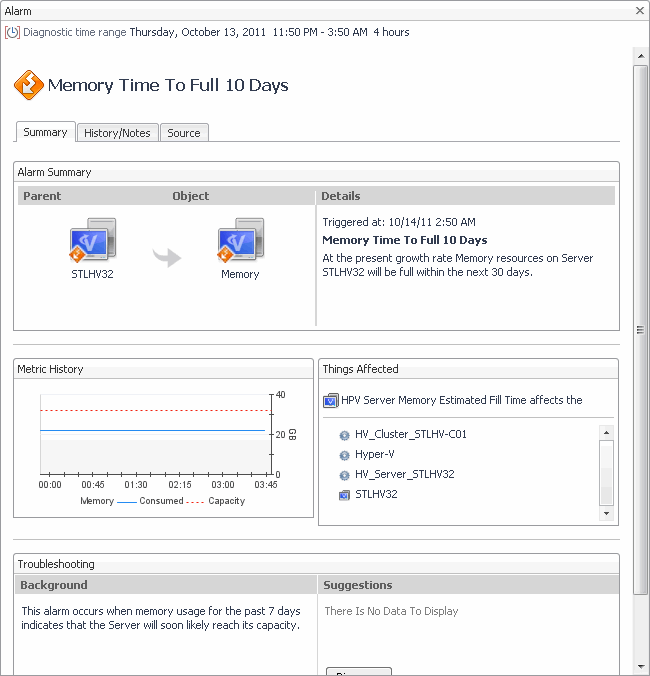
The Alarms List view shows all alarms fired in your Hyper-V® environment. For each alarm entry, it shows its severity, the time it was fired, the rule name that triggered the alarm, and the alarm message.
This view appears on the Hyper-V Alarms dashboard, just below the Alarm overview.
| |||
| |||
| |||
| |||
| |||
Figure 257. Select Drilldown dwell
From here, selecting Explorer shows the selected server or virtual machine in the Hyper-V Explorer, with the Hyper-V Explorer Summary tab open. Selecting Quick View shows the selected server or virtual machine in the Server Summary view or Virtual Machine Summary view.
| |||
Figure 258. Alarm Created dialog box
|
Setting the alarm sensitivity level
|
3 |
|
4 |
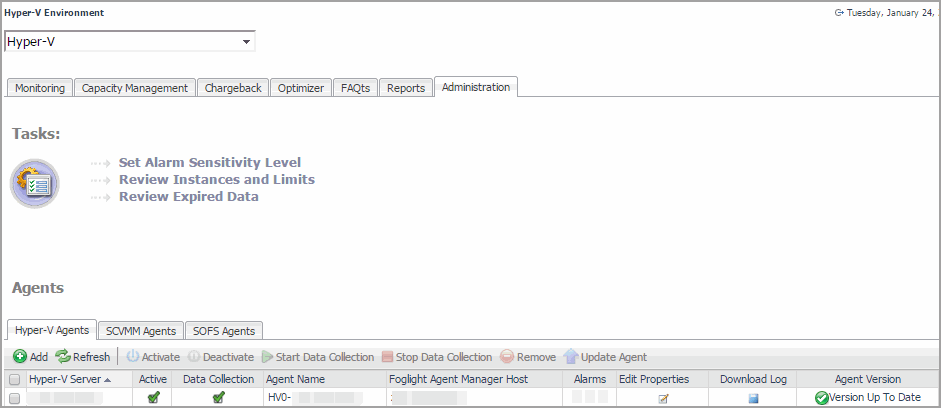
On the Hyper-V Environment dashboard that appears in the display area, click the Administration tab. |
|
5 |
|
6 |
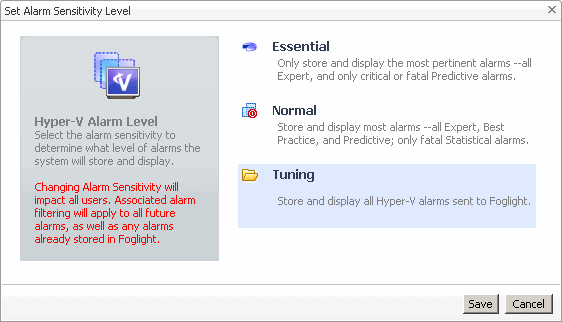
In the Set Alarm Sensitivity Level dialog box, select the desired sensitivity level: Essential, Normal, or Tuning. |
|
7 |
Click Save. |
Finding alarms using the action panel
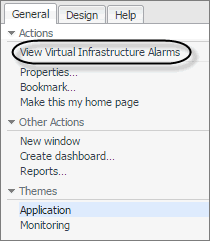
The action panel gives you quick access to a number of useful actions and tasks. It provides additional actions provided with Foglight® for Hyper-V when you are viewing the Hyper-V Explorer dashboard.
|
3 |
|
4 |
Appendix: Hyper-V Agent error codes
This appendix lists the error codes that the Hyper-V Agent returns when it encounters a connection problem. The error codes result in messages that appear in the alarms raised by the HPV Cluster CPU Estimated Fill Time rule.


