SQL Performance Investigator (SQL PI)
|
5 |
Select Client Machines under the selected SQL Statement, to view the computers on which the statement was run. |
The default Azure SQL Database dimensions are as follows:
The History section view is divided into two sections that are correlated to each other:
The Lock Analysis displays all locks that took place within the selected time range.
|
• |
|
• |
|
• |
|
• |
|
• |
|
• |
|
• |
|
• |
This view presents the execution plan of a selected SQL and the cost of it. A Historical execution plan can be generated from History by selecting the statement or batch and by clicking Open Plan in SSMS in the top of the table.
Azure SQL Activity Drilldown
Use the Azure SQL Activity drilldown to carry out the operations described in the following topics:
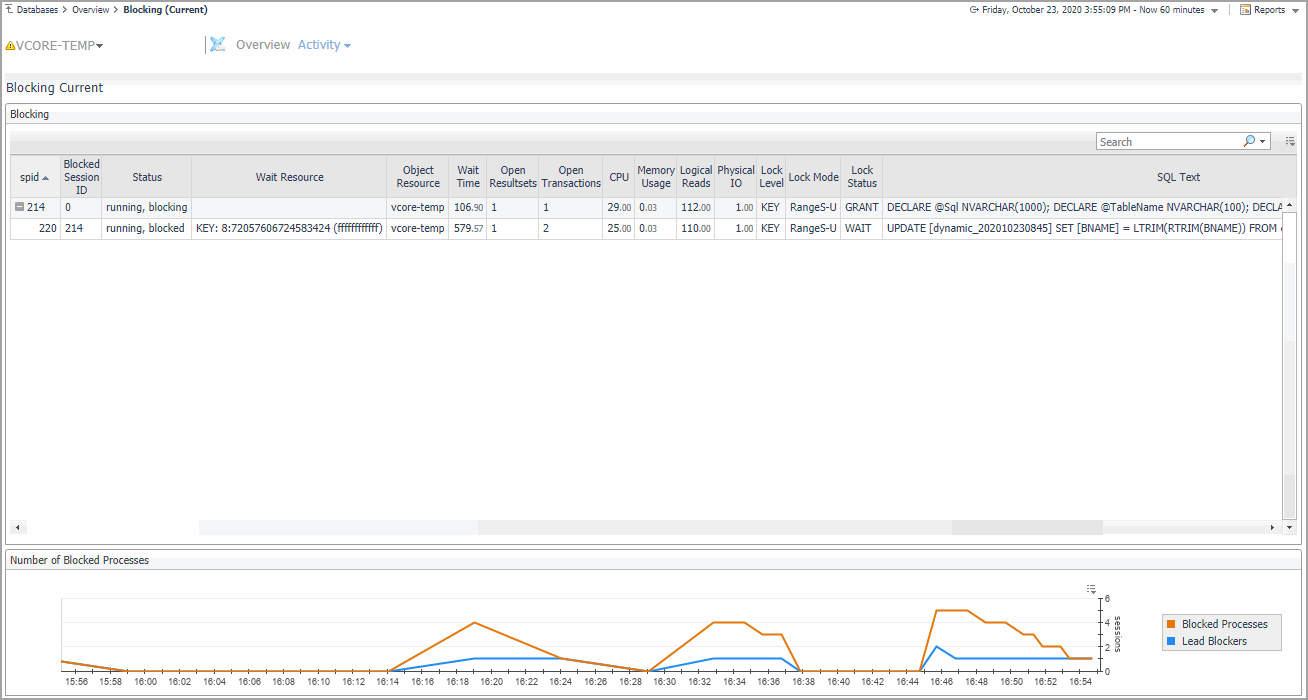
The Blocking (Current) panel provides details for all current lock conflicts.
This panel allows carrying out the tasks detailed in the following topics:
|
• |
|
• |
Monitoring the processes blocked during the reporting period, using the Number of Blocked Processes chart. For details, see Monitoring blocked processes for the sampled interval . |
The Blocking table displays all connections that are either currently waiting on locks held by others, or are causing others to wait, highlighting who is waiting on whom, and the resources involved.
To create a custom filter for this table, use the options accessible by clicking the Customizer button at the table’s upper right side. For details, see Components Shared by All Foglight for Azure SQL Database Screens .
The hierarchy in this tree diagram represents the blocking chains. It shows who is blocking whom, by displaying one entry for each session that is blocked, and one for each session that is blocking another but is not blocked itself. Sessions at the top of the tree (those that do not have a parent in the tree) are at the head of the blocking chain, and are therefore the root cause of all blocking. Such sessions appear as Lead Blockers in the Number of Blocked Processes chart.
|
Unique number the Server has assigned for identifying the selected session. | |
|
Object that is owned by the selected session and waited by the other session involved in the lock. | |
|
Open Result sets |
|
|
Number of logical reads that have been performed by the session. | |
The Number of Blocked Processes chart displays the number of Azure SQL Database sessions that were involved in blocks over time. Use this chart to review the frequency and duration of lock conflicts in Azure SQL Database.
This chart displays the following indicators:
|
• |
Blocked Processes — number of sessions that were waiting on locks held by others. |
|
• |
Lead Blockers — number of sessions that were not blocked, but were blocking others. Lead Blockers correspond to sessions in the Blocking table that do not have a parent in the Blocking chain (at level 1 in the tree). |
This panel can also be used to carry out the tasks described in the following sections:
The Sessions view in the table can be filtered by the Active only and Foreground Only check boxes:
The Sessions list provides detailed information about the sessions as follows:
Administering Foglight for Azure SQL Database
Opening the Databases Administration Dashboard
You can edit settings for one or more Azure SQL databases on the Databases > Administration dashboard.
|
1 |
|
3 |

