Using the configuration wizard
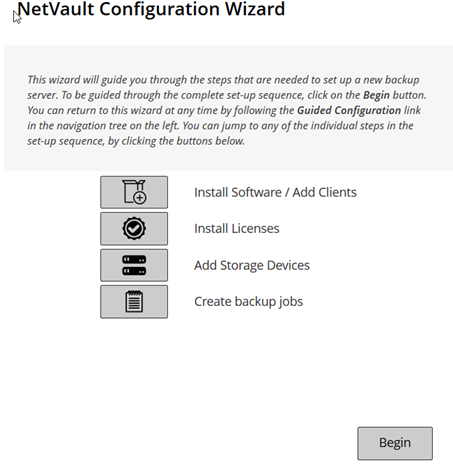
The NetVault Backup WebUI provides a configuration wizard that guides you through the various aspects of setting up your backup system. You can use the wizard to install client and plug-in packages, add clients, configure devices, install license keys, and create backup jobs. The configuration wizard can be accessed from the Guided Configuration link in the Navigation pane.
|
2 |
In the Navigation pane, click Guided Configuration. |
Monitoring the NetVault Backup Server
You can monitor the overall status of your NetVault Backup Server from the Server Monitor page. You can use this page to view the status of clients, devices, regular jobs, and policy jobs. The Activity Chart shows the data transfer rate for jobs and the number of active jobs. You can also view the events that occurred during the selected time window.
|
1 |
In the Navigation pane, click Server Monitor. |
|
2 |
On the Server Monitor page (see Figure 2, NetVault Backup WebUI home page for MSP admin), you can view the following information. |
|
You can click this area to open the Manage Clients page. | |||||||
|
This area shows the number of online devices and total device count only for MSP administrator. Move the pointer over the count to view total count, the number of offline devices and number and type of online devices. You can click this area to open the Manage Devices page. | |||||||
|
This area shows the total amount of data backed up from various clients. The total storage consumed is displayed to the MSP administrator. However tenant administrator and tenant users can view the consolidated storage consumed by them. MSP administrator can click this area to open the Explore Storage page. | |||||||
|
You can use the following settings to modify the Activity Chart:
By default, the event type is set to Errors Only. | |||||||
You can click a bar to open the Job Status page and view the job details for that category. For example, you can click the Active bar in the Current Activity area to view the jobs that are in progress. Similarly, you can click the Errors bar in the Regular Jobs area to view the regular jobs that have failed. |
Sorting records in NetVault Backup WebUI
To choose the following actions in a column, click the column menu:
Customizing tables in NetVault Backup WebUI
By default, the filter is not applied and all the records are displayed in the table. When you set the filters, the applied filter options are displayed above the table and the color of filter icon and table border is changed. For example, the filters are shown as View By: Current Activity, Run Status: Waiting, Scheduled, and so on. | |||||||||
|
To export the table data to a CSV format file, click this icon. | |||||||||
|
Click this icon for Table Settings:
|

