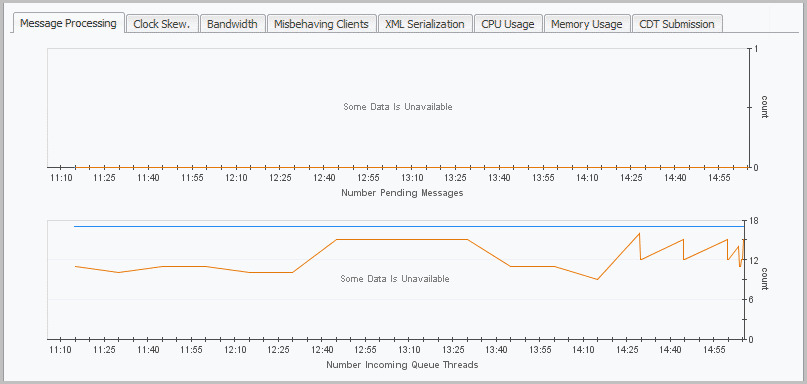
Message Processing tab
The Message Processing tab shows tables for the number of pending messages and the number of incoming queue threads for a selected Agent Manager instance.
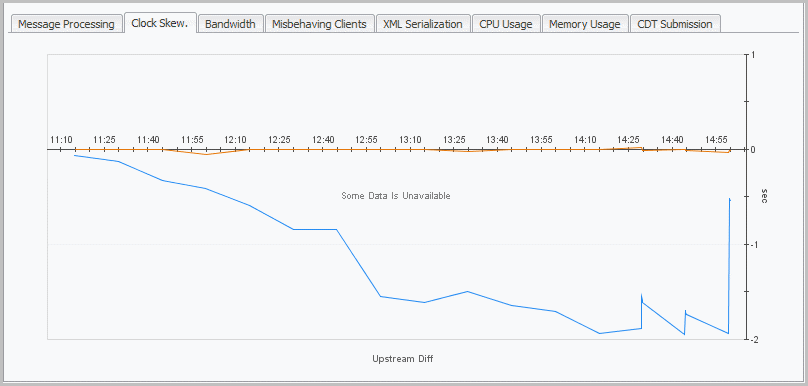
Clock Skew tab
The Clock Skew tab contains a graph that displays the upstream difference per second for a selected Agent Manager instance.
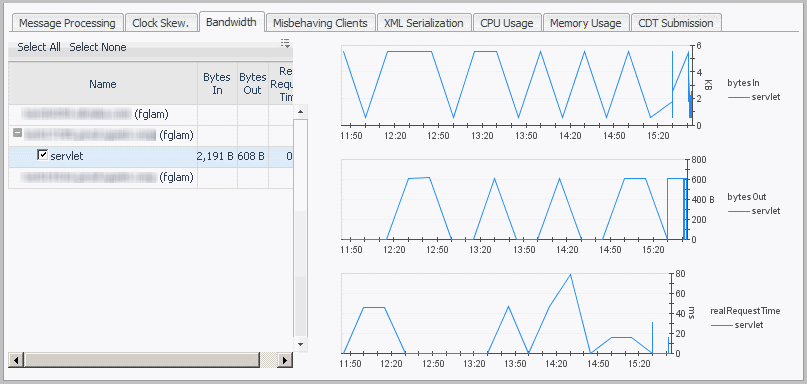
Bandwidth tab
The Bandwidth tab displays metrics for bandwidth usage samples taken at prescribed intervals per second for a selected Agent Manager instance, including the bytes in, bytes out, and real request time for a selected servlet. The bandwidth statistics reflect the bandwidth (bytes per second) used by the Agent Manager instance data over a specific time interval.
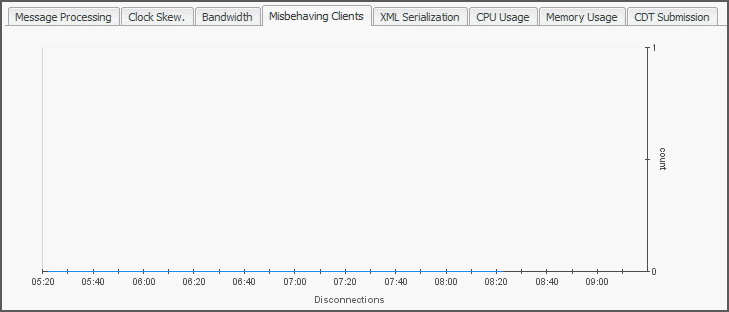
Misbehaving Clients tab
The Misbehaving Clients tab displays the disconnections per count for a selected Agent Manager instance.


