Misbehaving Clients tab
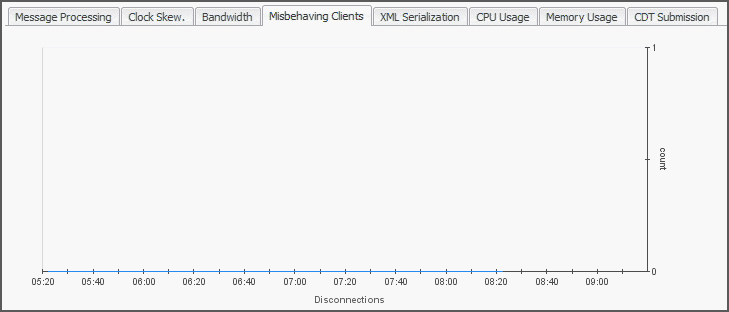
The Misbehaving Clients tab displays the disconnections per count for a selected Agent Manager instance.
XML Serialization tab
The XML Serialization tab shows graphs indicating the rates and times of message serialization to and from XML for a selected Agent Manager instance.
CPU Usage tab
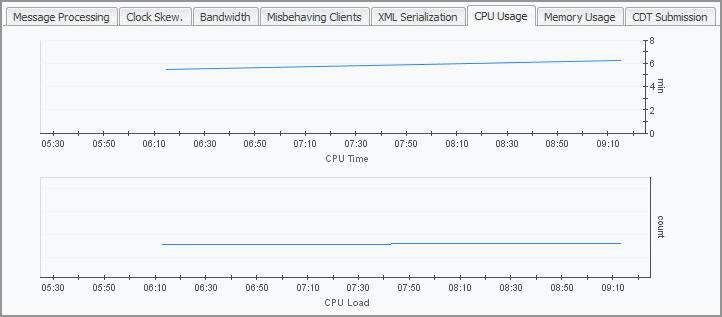
The CPU Usage tab displays the amount of time the CPU associated with a selected Agent Manager instance spends executing active processes and their number. For example, a sudden increase in CPU time may indicate that the user code is running inefficiently or a possible runaway process. Also, high CPU loads sometimes suggest that the host needs more CPU power to run efficiently.
Memory Usage tab
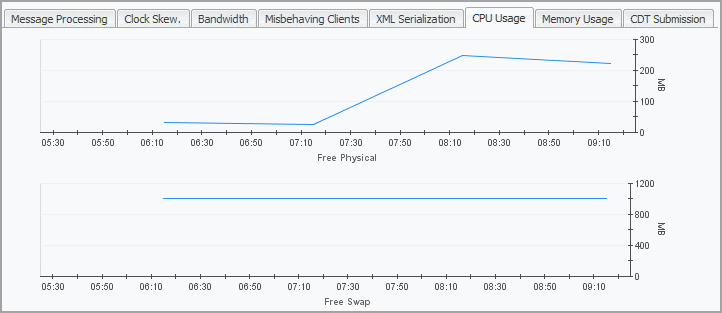
The Memory Usage tab displays the amount of available memory and swap space for a selected Agent Manager instance. For example, a shortage of swap space often suggests a memory shortage, while a decline in the available memory may indicate a memory leaking process.


