Investigating Sybase Performance
The Foglight Cartridge for Sybase measures efficiency by performing the following tasks:
|
• |
Open the SYBM_Overview graph view which displays an overview of the system performance of the Sybase Adaptive Server. Specifically, it shows the percentage of time the server was busy with User Requests, the percentage of time spent performing I/O requests, lock contention and cache hit rates for data and procedure caches along with user connection activity. |
|
• |
Drill down on the CPU - Busy (%) line to investigate how busy all Adaptive Server engines were during the time that the CPU was available to Adaptive Server. This data is displayed in the SYBM_EngineSummary graph view. See Investigating CPU Capacity for additional related information in Foglight. |
|
• |
|
• |
|
• |
|
• |
Drill down on the Lock Contention (%) line to investigate the total number of deadlocks, locks timed out, etc. This data is displayed in the SYBM_LockSummary graph view, see Investigating Locking for additional related information in Foglight. |
Investigating the User Log Cache
|
• |
Open the SYBM_UserLogCache graph view which displays the percentage of times the user log cache was flushed because it was full. |
About the Sybase_RS Agent
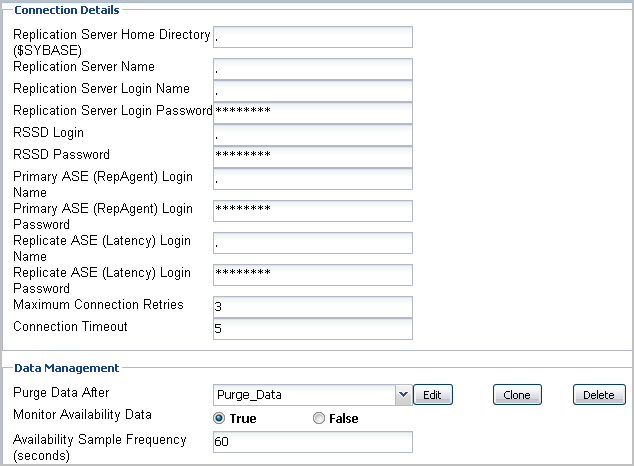
Sybase_RS Agent Properties
For more information about working with agent properties, see the Foglight Administration and Configuration Guide.
Agent properties described in this section comprise:
|
• |
On the navigation panel, under Dashboards, click Administration > Agents > Agent Properties. |
|
• |
On the navigation panel, under Dashboards, click Administration > Agents > Agent Status. |

