Cyclic Maintenance
Each of the following tasks helps to ensure that the Foglight® Management Server is stable and is operating normally.
Assuming you automate self-monitoring as described in Recommended Self-Monitoring Automation, there is no need to perform the checks described below.
For context on the key resource requirements and their effect on the Foglight Management Server, see the Foglight Performance Tuning Field Guide.
Perform the following tasks once every week:
Perform the following tasks manually, once every month:
|
• |
|
• |
For more information about these dashboards, see the related online help topics.
Using a single pane of glass for your administration needs
The Administration dashboard can be used as a front-end for most Foglight® administration tasks. This dashboard contains links to most of the administration dashboards and shows configuration specifics that may be critical to your day-to-day operation. If your Foglight role involves daily administration, this is probably the best place to start as it gives you a quick insight into the system complexity and its health, along with close-at-hand links to most administration dashboards.
You can access this dashboard from the navigation panel, by clicking Homes > Administration.
For more information, see the following topics:
Manage Foglight Database Performance
To access this dashboard, from the navigation panel, click Dashboards > Management Server > Servers. Then select either Object Cleanup or Retention Policies.
Another way to control the retention policies on a per-object basis is using the Manage Retention Policies dashboard. For more information, see Manage Data Retention.
In addition to the Object Cleanup and Retention Policies dashboards that allow you to inspect and tune the overall performance, the Database Overview dashboard summarizes the database activities such as data row operations, database buffer pool, and any inserts, deletes, and updates. To access this dashboard, from the navigation panel, click Dashboards > Management Server > Servers > Database Overview.
For more information, see the following topics:
Monitor Server Performance
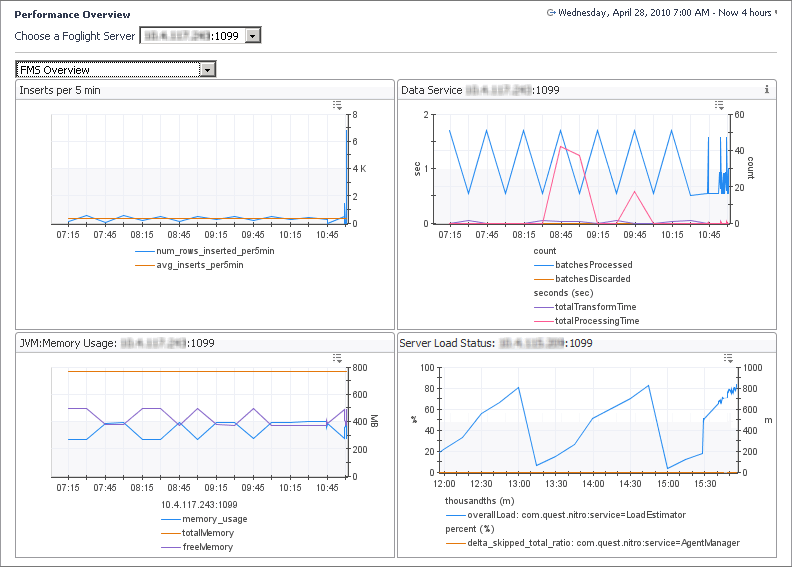
The Performance dashboard contains at-a-glance view of Foglight diagnostics. It shows the rate of database inserts, data processing activity, JVM memory usage, server load, and other combinations of views. Certain types of metric patterns displayed on this dashboard can be useful in troubleshooting specific performance problems. For example, a sudden increase in free memory utilization is a good indicator that the amount of incoming data exceeds typical thresholds. To access this dashboard, from the navigation panel, click Dashboards > Management Server > Diagnostic > Performance.
The Management Server View dashboard is useful for examining server performance. Use it to look for root causes of server-related performance problems. To access this dashboard, from the navigation panel, click Dashboards > Management Server > Servers > Management Server View.
Server log files are another source of information that can help you diagnose the root cause of performance-related bottlenecks. They contain information about known events and error conditions as well as verbose or informational messages. The Log Analyzer dashboard allows you to analyze generated log files or download a selected log file to a desired location. To access this dashboard, from the navigation panel, click Dashboards > Management Server > Diagnostic > Log Analyzer.


