
Using Alerts
You can use Metalogix Diagnostic Manager alerts to help you monitor your SharePoint farms, Server Groups, and Office 365 tenants.
You specify the conditions that trigger Warning and Critical alerts. When the Collection Service detects these conditions, it generates an alert. You can set default conditions or set conditions on a per-server and per-page basis.
You can specify comments that Metalogix Diagnostic Manager includes in alerts. You define the alert comments for each metric separately. You can set a default comment for all alerts for a particular metric. You can also customize comments for server and monitored page alerts.
When an alert is generated, it is an active alert. When the alert is superseded or no longer applies, it is no longer an active alert. You can choose to view all alerts or only active alerts. You can specify if alerts are written to the event log or if an email is sent.
You also have the option of clearing an alert. A cleared alert no longer appears in the Management Console and does not impact the status of the page, server, or farm that used it.
About Alerts
When the conditions that triggered an alert change, Metalogix Diagnostic Manager can generate a new alert.
Not all alerts are of the same importance. Depending on their importance, each alert can be a Warning Alert or a Critical Alert. You can use the Alerts view to filter alerts based on the alert importance.
The alert status for any monitored page, server, or farm is based on the most recently generated alert status for each of the elements that make up the component. The most serious alert status for any element dictates the alert status for the component as a whole. When you review the alerts for the component, you can see the alerts for the elements that make up the component. When Metalogix Diagnostic Manager calculates the status of a page, server, or farm, metrics with cleared alerts are treated as if their status was OK. A cleared alert does not cause a Warning or Critical component status.
When you disable data collection for any monitored page or server, the alert status for that component is set to OK. When you enable data collection again, the status remains OK until new data is collected.
In the same way, if you disable Page Load Time testing or Page Component Analysis, the alert status for the disabled test is set to OK. When you enable the test, the status remains OK until new data is collected.
Viewing Alerts
The means by which you access Active Alerts depends on which node you select in the Management Console tree.
How to View Alerts:
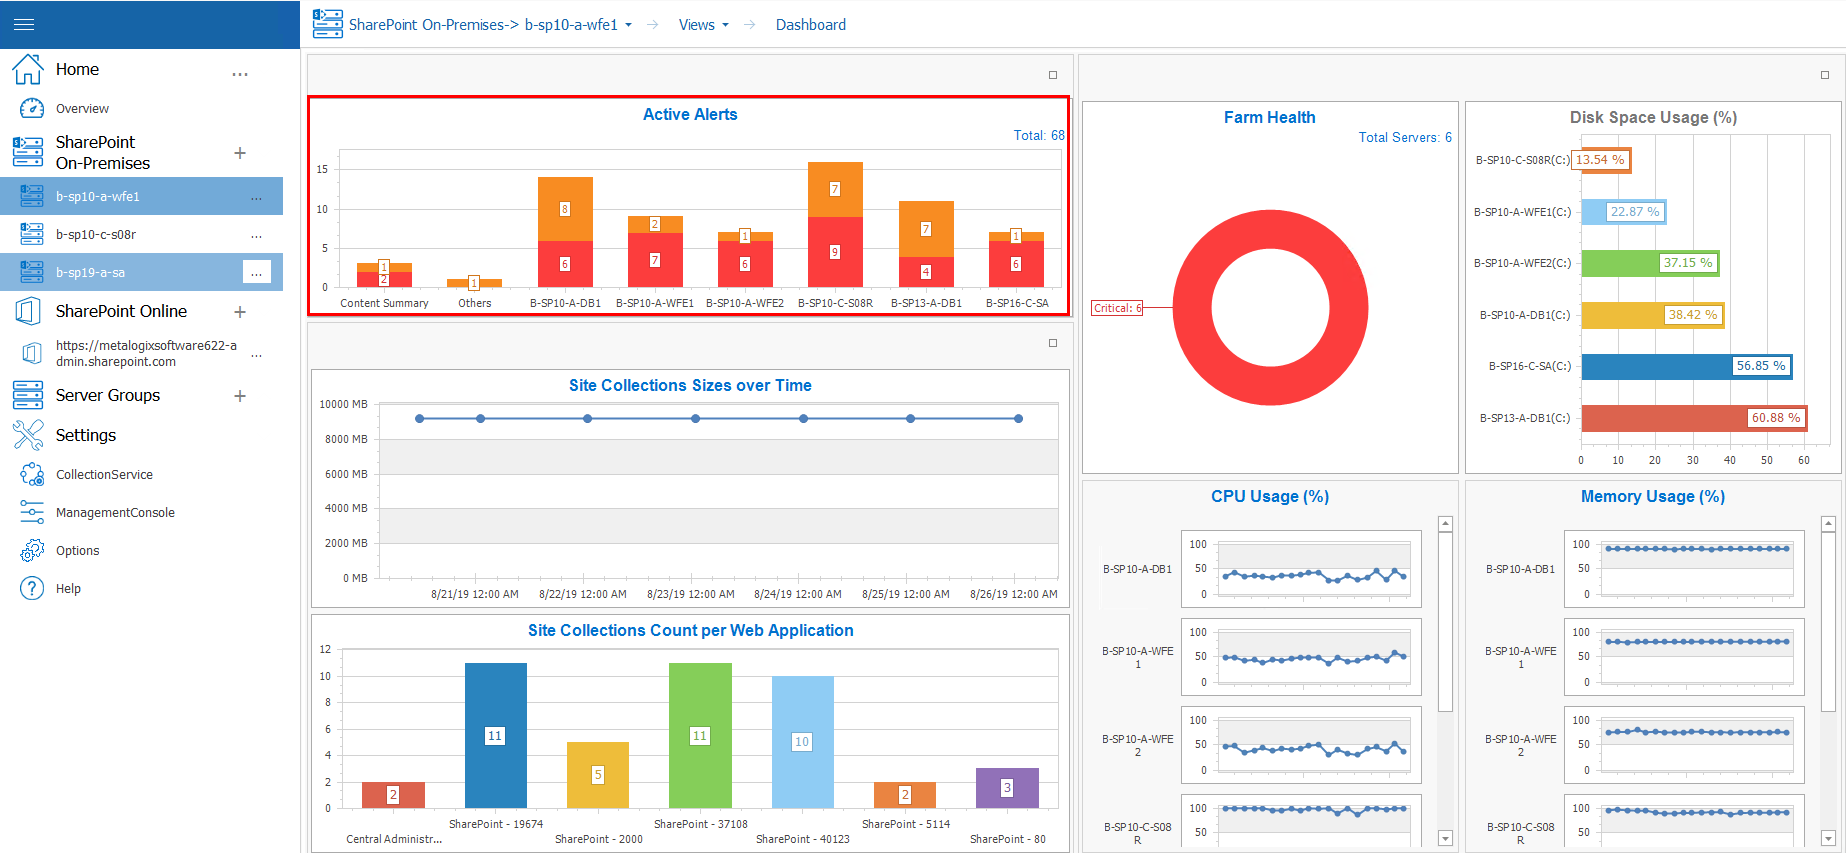
You can view alerts for a monitored farm or Server Group by double-clicking a bar in the Active Alerts graph on the Overview page of a farm or server group.
You can also access alerts by double clicking the farm, and then selecting its name in the top navigation, this opens a sub panel, where you can select Alerts in order to view the alerts.

The following information appears in the list of active alerts:
|
Information |
Description |
|---|---|
|
Alert severity |
An icon indicating the severity level of the alert. |
|
Priority |
The relative importance of the alert.
You can sort this column to group alerts by priority. The default value for Priority is 3, but you can change this value when you edit alert thresholds. |
|
Change |
The way that the alert reached the current level. |
|
Time |
The date and time when the alert was generated. |
|
Alert |
The name of the metric that generated the alert. |
|
Farm / Group |
The farm or Server Group where the selected server resides. |
|
Server |
The server the alert affects. |
|
Instance |
The instance that the alert affects. For some metrics, more than one instance of the source of the metric can exist for a given server or page. |
|
Value |
The actual value of the metric that is the source of the alert. |
Viewing Alert Details
To view alert details:
In the Alerts view, select the alert whose details you want to view.
Now you can either:
·review the information in the Details section at the bottom of the pane (if available)
OR
·double-click the alert or right-click and choose View alert details to open the detail in a separate window.
The information that appears in the alert details can vary, depending on the metric to which the alert applies. The following information can appear in the alert details:
|
Information |
Description |
|---|---|
|
Severity |
The severity of the alert. |
|
Metric |
The type of condition that generated the alert. |
|
Instance |
The instance name, if any, that generated the alert. The instance appears only for applicable alerts. |
|
Server |
The server that generated the alert. |
|
Value |
The actual value of the metric that is the source of the alert. |
|
Time |
The time that an event generated the alert. |
|
Farm |
The SharePoint farm or Server Group that generated the alert. |
|
Change |
The change that the alert represents. |
|
Page (if applicable) |
The page for which the metric generated the alert. If the alert is for a server, then Metalogix Diagnostic Manager does not display a page. |
|
Warning Threshold |
When a metric value meets the specified threshold, Metalogix Diagnostic Manager creates an alert with the warning severity. You can edit your alert thresholds by clicking [Edit Alert Thresholds]. Metalogix Diagnostic Manager displays this button only if the alert threshold is editable. |
|
Critical Threshold |
When a metric value meets the specified threshold, Metalogix Diagnostic Manager creates an alert with the critical severity. You can edit your alert thresholds by clicking [Edit Alert Thresholds]. Metalogix Diagnostic Manager displays this button only if the alert threshold is editable. |
|
Details |
Details about the alert condition. |
|
Comments |
Any comments that you included in the alerts. You specify the comments to include when you define the alert condition. |
|
Metric History |
The history of the alert over a specified period. This information appears only for alerts containing a numeric component. |
|
Alert Information |
Information about the significance of the metric from the Metalogix Diagnostic Manager Knowledge Base. You can add custom information about the metric as it applies to your SharePoint farm by clicking [Edit Knowledge Base]. See also Customizing the Knowledge Base. |