Disabling Data Collection for a Monitored Page
If you disable data collection for a monitored page, the Collection Service no longer retrieves information about the page.
|
|
NOTE: When you disable data collection for a page, any historical data is retained in the Repository. You can continue to use the Management Console to review any stored data about the page, but no new data is collected. |

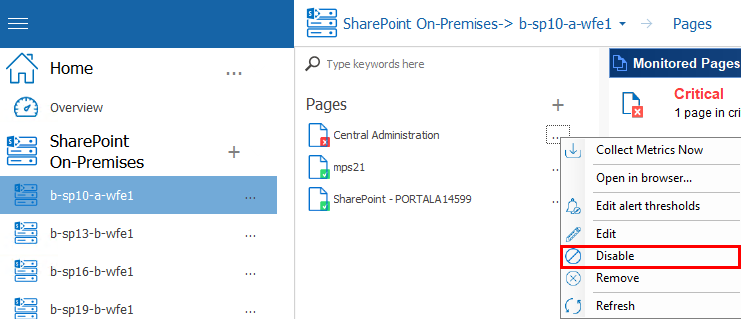
To temporarily disable data collection for a page:
1.In the Management Console, double click on the farm which contains the server you wish to disable data collection form.
2.Select the farms' name above the view pane, and select Pages from the drop down pane.

3.Select the (...) next to the page for which you would like to disable data collection, select Disable from the drop down menu.
|
|
NOTE: A disabled page will display in the tree with a |
 icon.
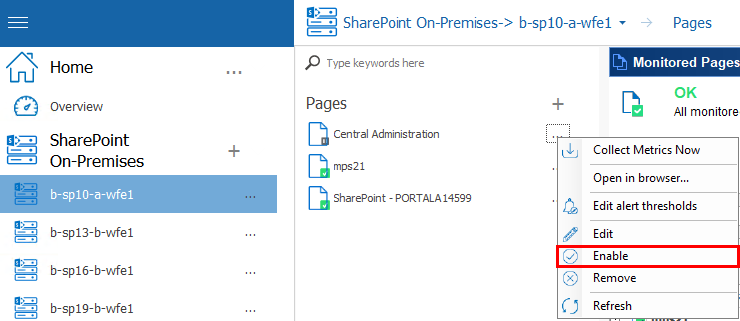
icon.To re-enable data collection for a page
1.In the Management Console, double click on the farm which contains the server you wish to disable data collection form.
2.Select the farms' name above the view pane, and select Web Applications from the drop down pane.

3.Select the (...) next to the web application for which you would like to disable data collection, select Enable from the drop down menu.
Setting the Management Console Preferences
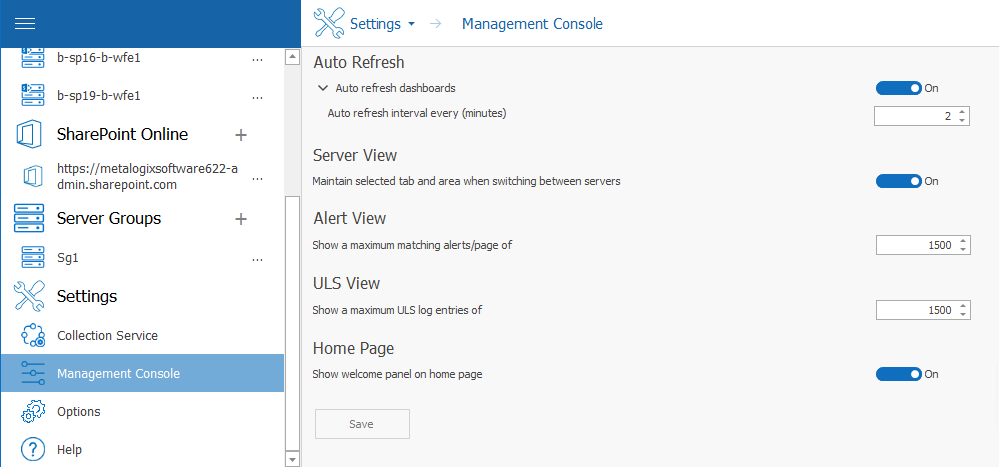
You can make changes to the following Management Console preferences:
|
For the following preference ... |
You can specify ... |
|
Auto Refresh |
whether to disable or enable the dashboard auto refresh for a specific time interval. |
|
Server View |
whether to maintain the selected tab and area when switching between servers. |
|
Alert View |
the maximum number of alerts to display per page. |
|
ULS View |
the maximum number of ULS log entries to display in the list. |
|
Home Page |
whether to display or hide the Welcome panel on the Home page. |
To set the Management Console preferences:
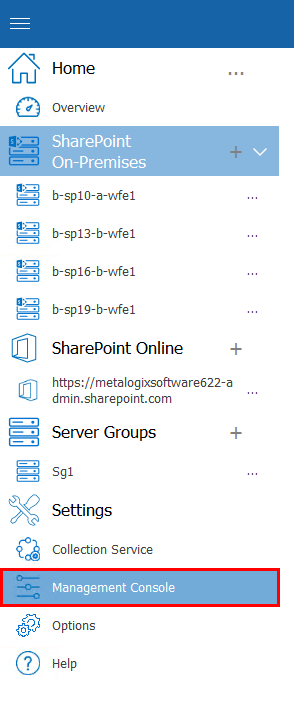
1From the Management Console left hand panel, choose Management Console.
2In the Management Console Preferences dialog box, make any desired changes to the options.
3Click Save to close the dialog box and save the changes.
Moving your Repository to a Different SQL Server Instance
You can move your Metalogix Diagnostic Manager repository database from one SQL Server instance to another if necessary. It is important that you first stop the Collection Service before migrating the data between the instances.
To move your repository from one SQL Server instance to another
1Stop the Collection Service.
2Use the following steps to move the database:
a)Detach from the source SQL Server instance.
b)Copy the database to the target SQL Server instance.
c)Attach the database in the target SQL Server instance.
3Update the CollectionService.exe.config file, usually located at c:\Program Files (x86)\\Metalogix Diagnostic Manager\CollectionService\. The value RepositoryHost specifies the name of the SQL Server instance hosting the repository.
4Restart the Collection Service.
Setting the Collection Service Options
Metalogix Diagnostic Manager lets you specify how the Collection Service behaves. You can also view information about the Collection Server service host, version, and other configuration information.
|
|
NOTE: The time at which a job is scheduled to run reflects the local time of the server on which the Collection Service was installed. |
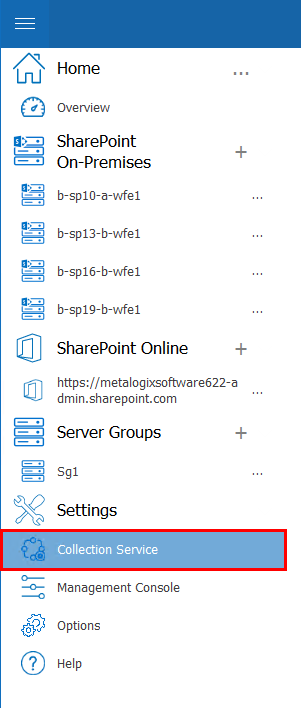
To access the Collection Service Options dialog:
From the Management Console choose Collection Service Options, found within the Settings section.