Managing Metalogix Diagnostic Manager
You can specify the options for the Management Console and Collection Service, including the Repository. You can also force Metalogix Diagnostic Manager to collect data from servers and pages or even suspend data collection.
Temporarily Suspending Data Collection
You may want to temporarily stop collecting data from part of your SharePoint deployment. With Metalogix Diagnostic Manager, you can choose to temporarily stop collecting data from any server, Web application, or monitored page.
Disabling Data Collection for a Server
If you disable data collection for a server, the Collection Service no longer retrieves information about the memory, CPU, or disk states on any server type. On Web front end (WFE) hosts, the Collection Service also stops retrieving information about Internet Information Server (IIS). Finally, the Collection service stops monitoring pages on disabled servers. If the disabled server is the only WFE you use to monitor the page, then no data is collected for the page. If you collect data about the page from another WFE and the other WFE is enabled, the Collection Service continues to monitor the page on the enabled WFE. If you monitor a page on all WFEs, the Collection Service excludes the disabled server when it monitors the page. In addition, the Collect Metrics Now option in the ribbon in the Server Dashboard view becomes disabled.
|
|
NOTE: When you disable data collection for a server, any historical data is retained in the Repository. You can continue to use the Management Console to review any stored data about the server, but no new data is collected. |

To temporarily disable data collection for a server:
1.In the Management Console, double click on the farm which contains the server you wish to disable data collection form.
2.Select the farms' name above the view pane, and select Servers from the drop down pane.
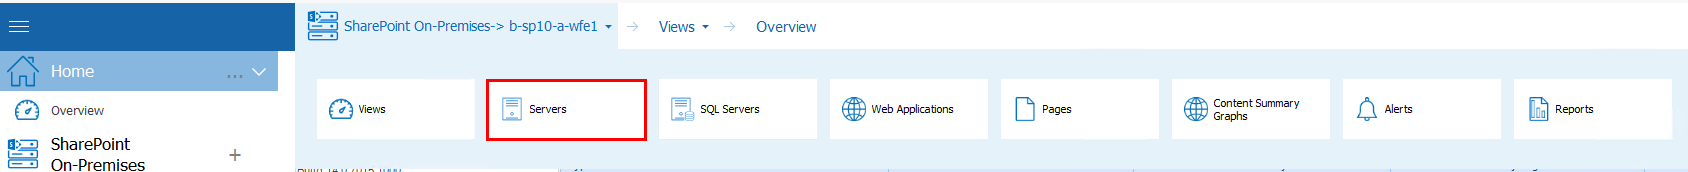
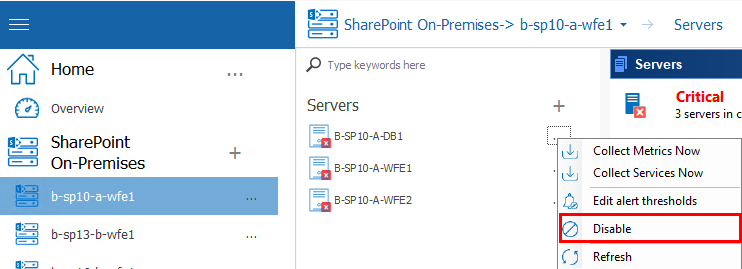
3.Select the (...) next to the server for which you would like to disable data collection, select Disable from the drop down menu.
|
|
NOTE: A disabled server will display in the tree with a |
 icon.
icon.To enable data collection for a server:
4.In the Management Console, double click on the farm which contains the server you wish to disable data collection form.
5.Select the farms' name above the view pane, and select Servers from the drop down pane.
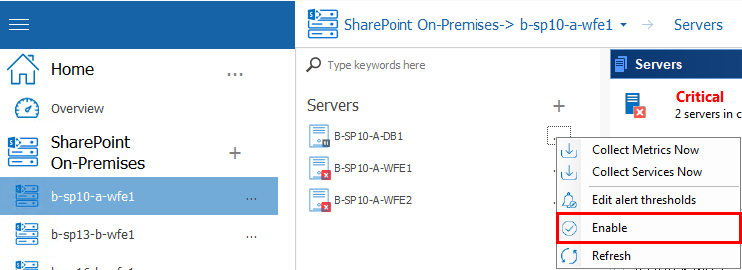
6.Select the (...) next to the server for which you would like to disable data collection, select Enable from the drop down menu.
Disabling Data Collection for a Web Application
If you disable data collection for a Web application, the Collection Service no longer retrieves information about the Web application or any of the site collections within it.
|
|
NOTE: When you disable data collection for a Web application, any historical data for the Web application and the site collections it hosts is deleted from the Repository. However, any monitored pages within the Web application that were manually added to Metalogix Diagnostic Manager will continue to be monitored. |
To temporarily disable data collection for a Web application:
1.In the Management Console, double click on the farm which contains the server you wish to disable data collection form.
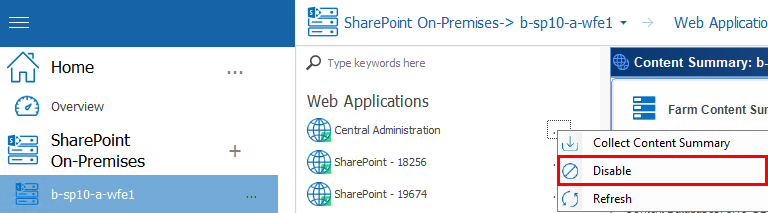
2.Select the farms' name above the view pane, and select Web Applications from the drop down pane.

3.Select the (...) next to the web application for which you would like to disable data collection, select Disable from the drop down menu.
4.You will be prompted to confirm the action before continuing.
|
|
NOTE: A disabled Web application will display in the tree with a |
 icon.
icon.Note that, when a Web application is disabled, the site collections it hosts will no longer be visible in the Management Console tree.
To re-enable data collection for a Web application:
5.In the Management Console, double click on the farm which contains the server you wish to disable data collection form.
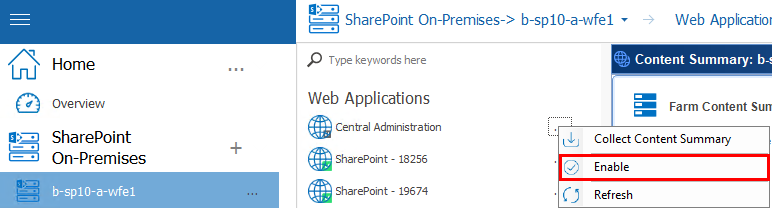
6.Select the farms' name above the view pane, and select Web Applications from the drop down pane.
7.Select the (...) next to the web application for which you would like to disable data collection, select Enable from the drop down menu.
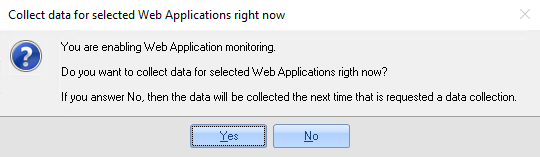
8.You will be prompted to choose whether you want to:
collect data for the Web application immediately
OR
wait until the next time a data collection is requested.