Viewing Pre-Defined Report Definitions
To view a pre-defined report definition:
Use one of the following options:
1.In the Management Console, select either Overview, or a farm whose reports you wish to see.
2.Click the farm name, above the overview area, and select Reports from the drop down pane.

3.From the left hand pane, select the report that you would like to view.
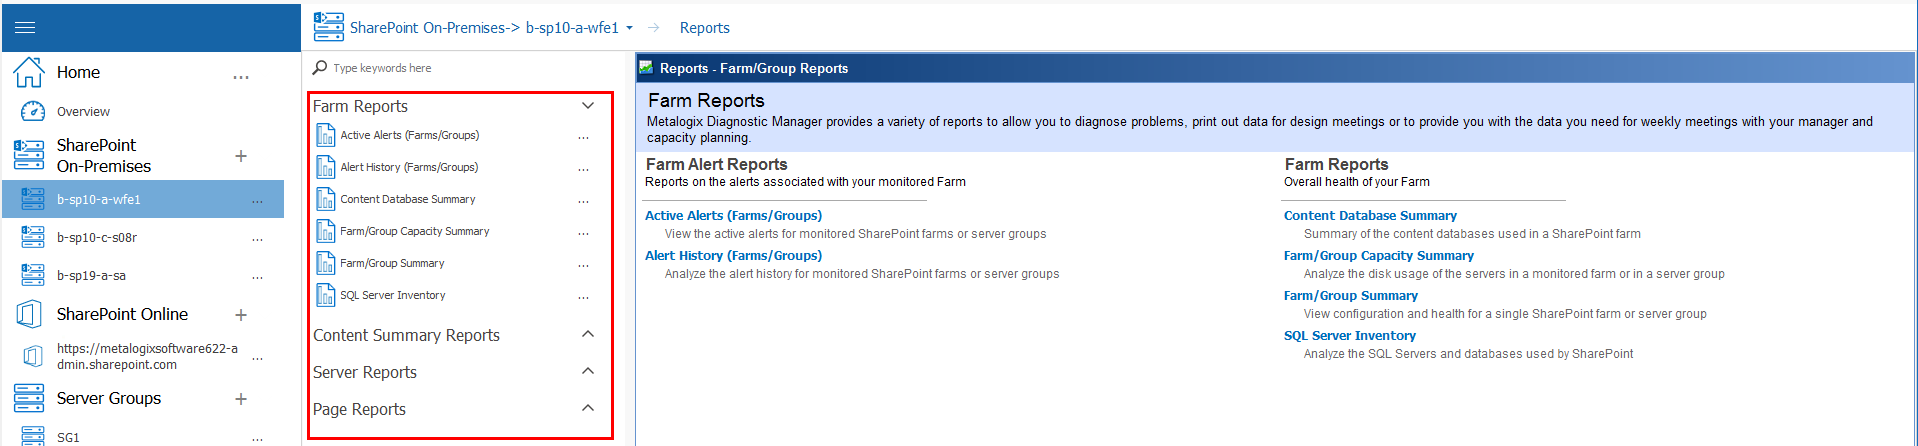
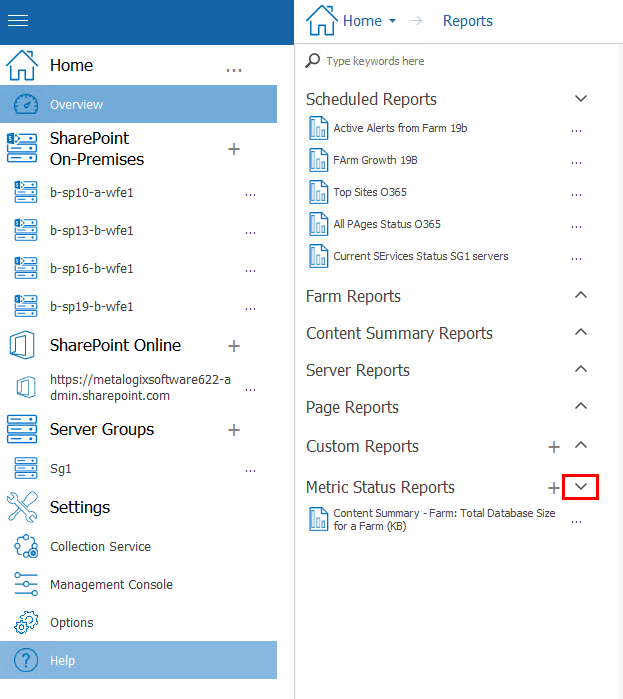
·The reports are grouped by subject matter, selecting the \/ next to the group name will expand the list of available reports within that category.
The Reports view displays the report that you selected. The Reports view includes additional information about the report and the information that the report contains.
After you select the appropriate parameters, you can you can run the report.
Creating and Using Metric Status Reports
You can create a report for a single metric for which Metalogix Diagnostic Manager collects data. You can select from almost 200 metrics, and include multiple farms, Server Groups, and servers in the report.
|
|
NOTE: Only one report can be created per metric. |

To create a Metric Status Report:
1.In the Management Console, select either Overview, or a farm whose reports you wish to see.
2.Click the farm name, above the overview area, and select Reports from the drop down pane.
3.Select the (+) next to the Metric Status Reports section. 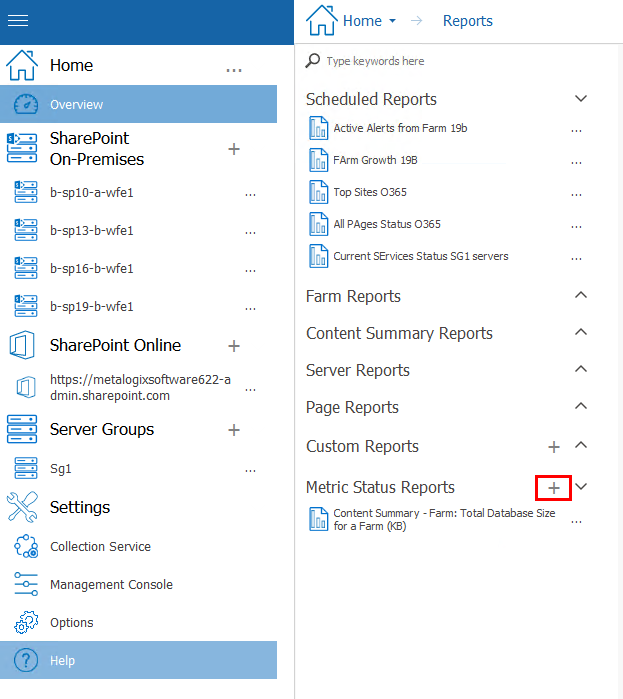
4.In the Select Report Metrics dialog box, enter a unique name for the report in the Report name field.
5.Select the metric for whose status you want to report.
6.Click OK.
The new report displays in both the Management Console tree and the Reports - Metric Status Reports view.
To run a Metric Status Report:
1.In the Management Console, select either Overview, or a farm whose reports you wish to see.
2.Click the farm name, above the overview area, and select Reports from the drop down pane.
3.Select the (\/) next to the Metric Status Reports section, and double click on the report you wish to run.
4.In the Report view, select the report filters from the drop-down lists.
5.Now you can run the report.
To edit a Metric Status Report name:
1.In the Management Console, select either Overview, or a farm whose reports you wish to see.
2.Click the farm name, above the overview area, and select Reports from the drop down pane.
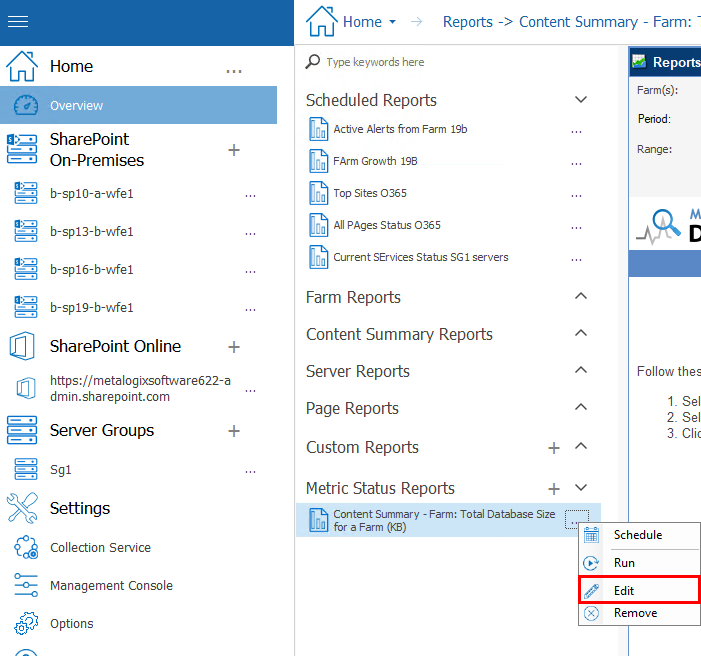
3.Select the (\/) next to the Metric Status Reports section, and select the (...) next to the report which you would like to run, and select edit from the drop down menu.
4.In the Select Report Metrics dialog, update the Report name then click OK.
To delete a Metric Status Report:
1.In the Management Console, select either Overview, or a farm whose reports you wish to see.
2.Click the farm name, above the overview area, and select Reports from the drop down pane.
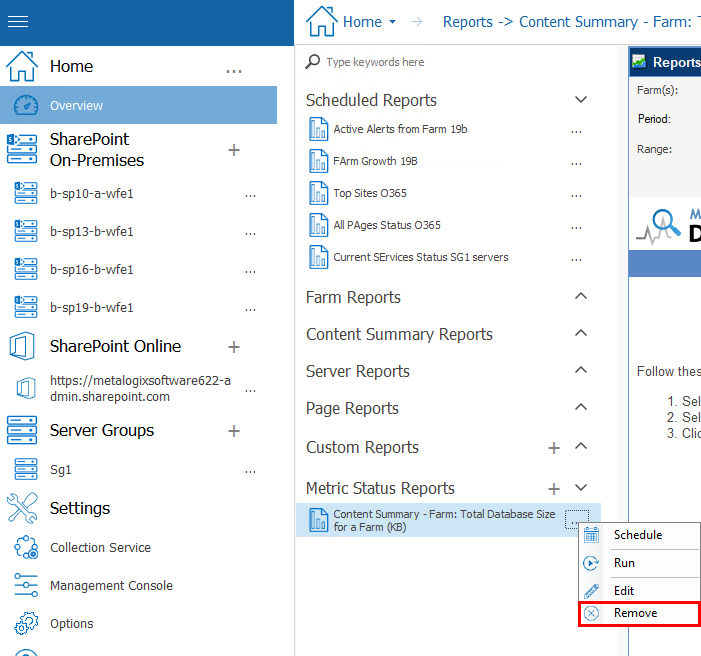
3.Select the (\/) next to the Metric Status Reports section, and select the (...) next to the report which you would like to run, and select Remove from the drop down menu.
Creating and Using Custom Reports
Every environment has unique reporting needs. If the standard reports that Metalogix Diagnostic Manager provides do not meet your needs, you can create custom reports.
A custom report can include up to 10 metrics, each of which is presented in its own line chart. You can include any combination of metrics. When you run the report, you specify the server to include in the report, along with the range of data to include and the granularity of the data. You can also choose to include or omit the tabular data that makes up the chart in the report.
|
|
NOTE: Currently, you cannot schedule custom reports nor export them to CSV. |
To create a custom report:
1.In the Management Console, select either Overview, or a farm whose reports you wish to see.
2.Click the farm name, above the overview area, and select Reports from the drop down pane.
3.Select the (+) next to the Custom Reports section. 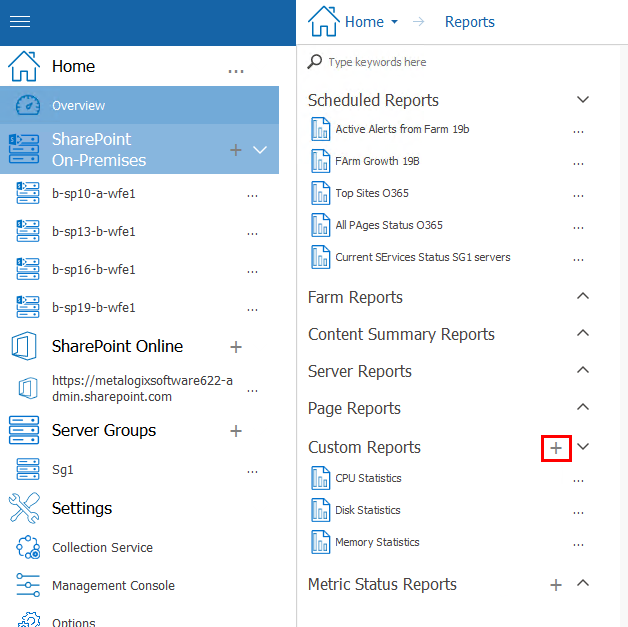
4.In the Add Custom Report dialog, enter a unique name for the report in the Report name field.
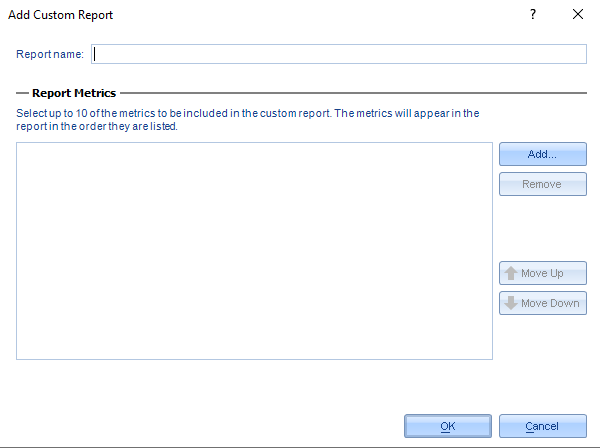
5.Select Add, the select report metrics window will open, you can Control-Click to select multiple metrics.
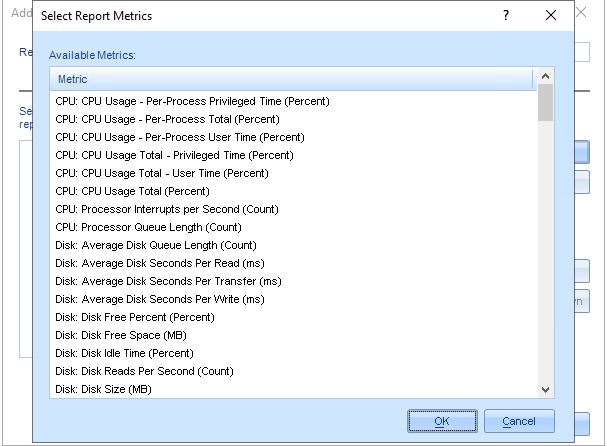
6.When you have selected the metrics to include, click OK.
The new report displays in the Management Console tree and the Reports -Custom Reports view.
To run a custom report:
1.In the Management Console, select either Overview, or a farm whose reports you wish to see.
4.Click the farm name, above the overview area, and select Reports from the drop down pane.
5.Select the (\/) next to the Custom Reports section. 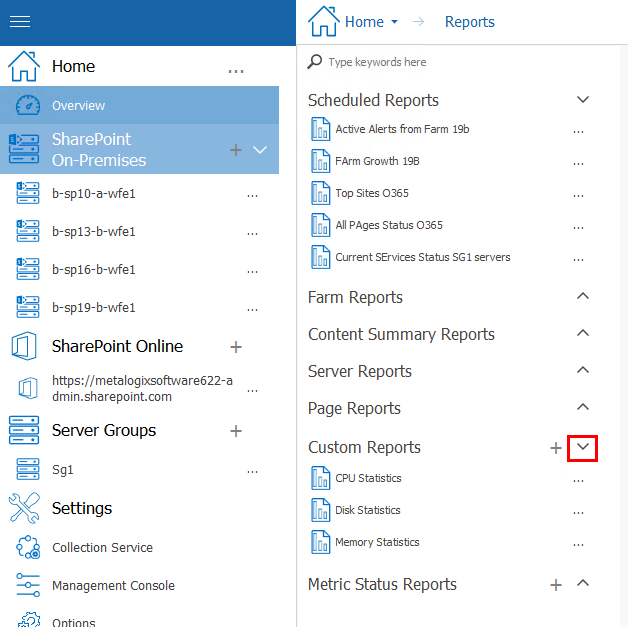
6.In the Custom Reports view, select the report filters from the drop-down lists.
|
|
NOTE: Use the Sample filter to specify the intervals at which data should be mapped. If you want to Show Tabular Data along with the chart(s), check this box. |
7.Now you can run the report.
To edit a custom report definition:
1.In the Management Console, select either Overview, or a farm whose reports you wish to see.
2.Click the farm name, above the overview area, and select Reports from the drop down pane.
3.Select the (\/) next to the Custom Reports section, and select the (...) next to the report which you would like to run, and select edit from the drop down menu.
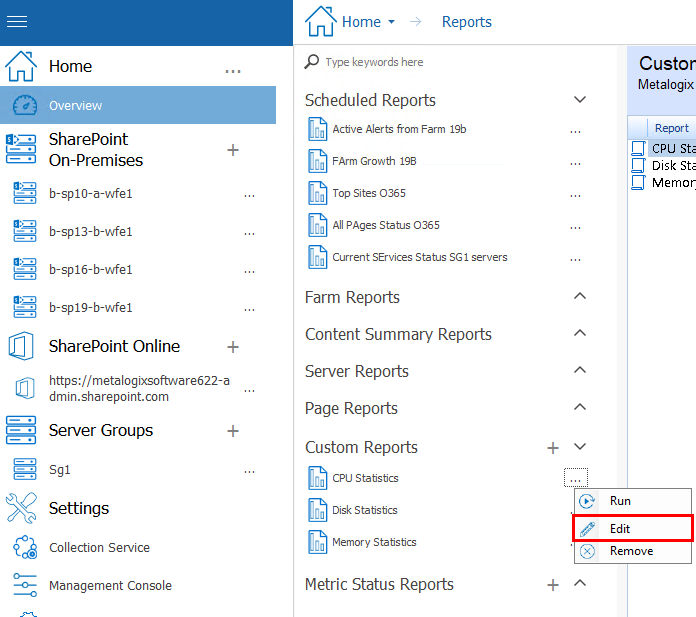
4.Now you can update the Report name, change the order in which metrics are displayed in the report, and/or add/remove metrics, and click Ok.
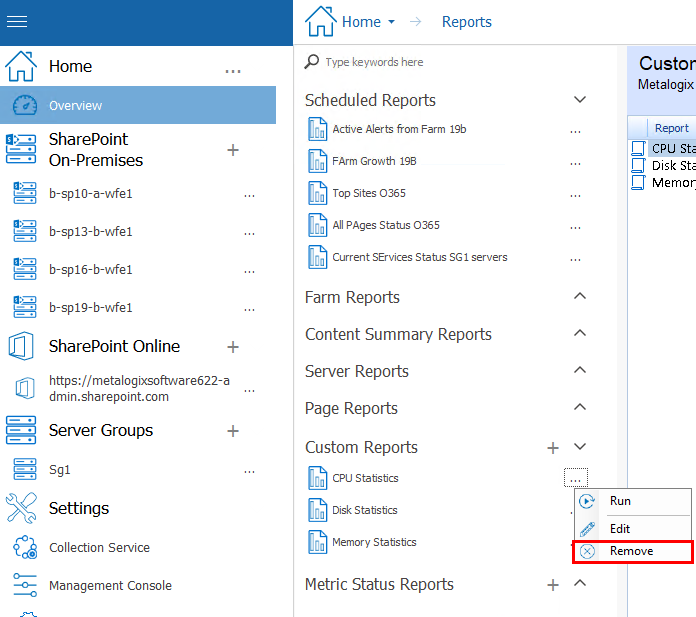
To delete a custom report:
1.In the Management Console, select either Overview, or a farm whose reports you wish to see.
2.Click the farm name, above the overview area, and select Reports from the drop down pane.
3.Select the (\/) next to the Custom Reports section, and select the (...) next to the report which you would like to run, and select Remove from the drop down menu.
Running a Report
Once you have created a report and selected filters, you can:
·run the report immediately by clicking the (...) next to the report you wish to run, and selecting Run from the drop down menu.
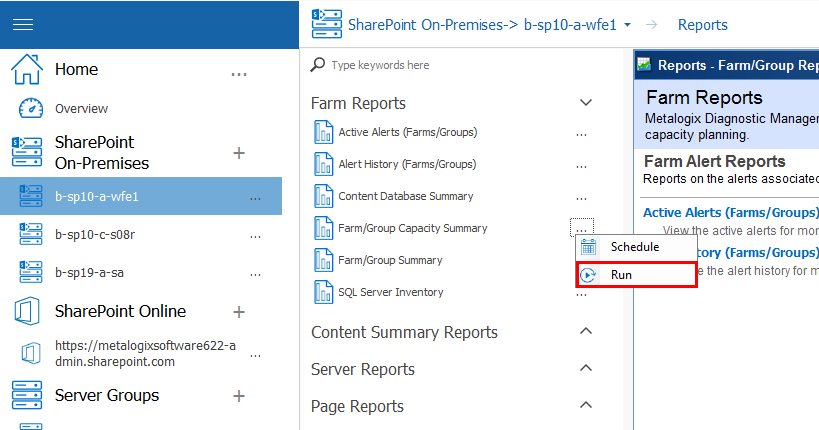
OR
·schedule the report to run at a later time and/or on a recurring basis.
If you chose to run the report immediately, from Report results you can do the following:
·Click the First Page, Previous Page, Next Page, and Last Page buttons to view the report pages.
·Click the Refresh icon (
·Click the Print icon (
·Click the Print Layout icon (
·Click the Page Setup icon (
·Click the Export icon (
|
|
NOTE: If you select the CSV option, only tabularnot graphicaldata will be output. For reports that include graphical data (such as Statistics or certain Summary reports) that you want to output to CSV, tabular data will be included regardless of whether the Show Tabular Data box is checked. |