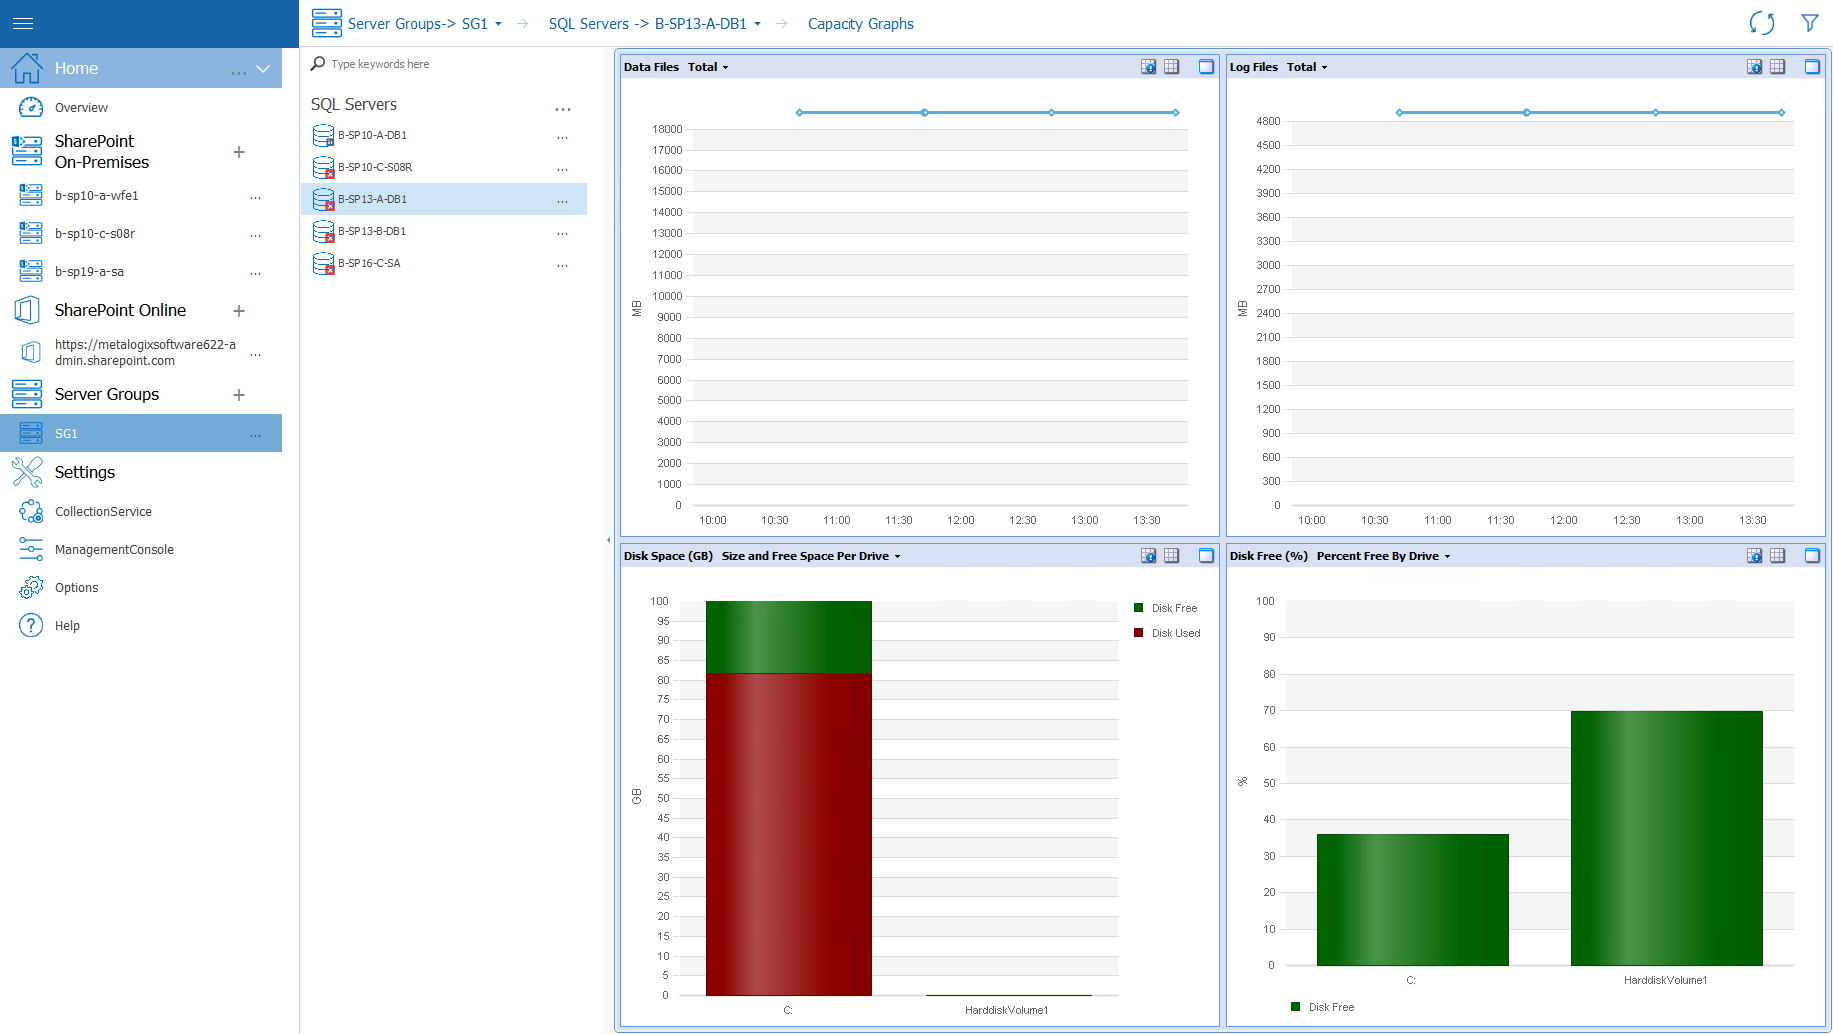
Viewing the Performance of a Single SQL Server
To view graphical performance data for a single SQL server:
|
|
NOTE: In the case of SQL AlwaysOn, some performance data will be collected for active nodes only. |

8In the Management Console tree, select the farm whose SQL Servers you want to view.
9Select the name of the farm above the overview pane, this will provide a drop down panel, select SQL Servers.
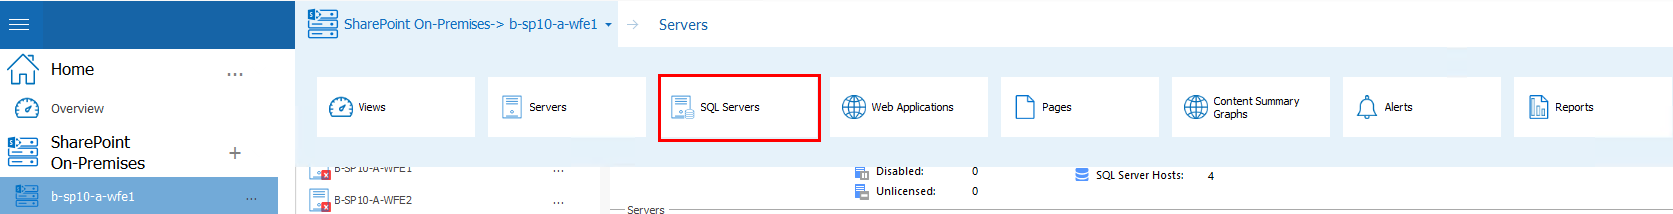
10Double Click on the SQL Server whose dashboard you want to view. Select the SQL Server's name above the viewing pane, and select Capacity Graphs from the drop down panel.
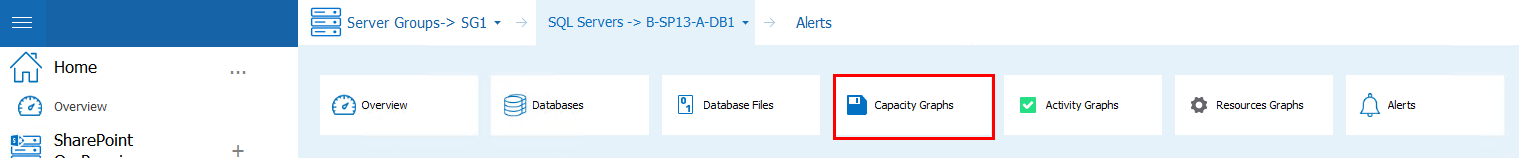
11This will open the Capacity Graphs Page.
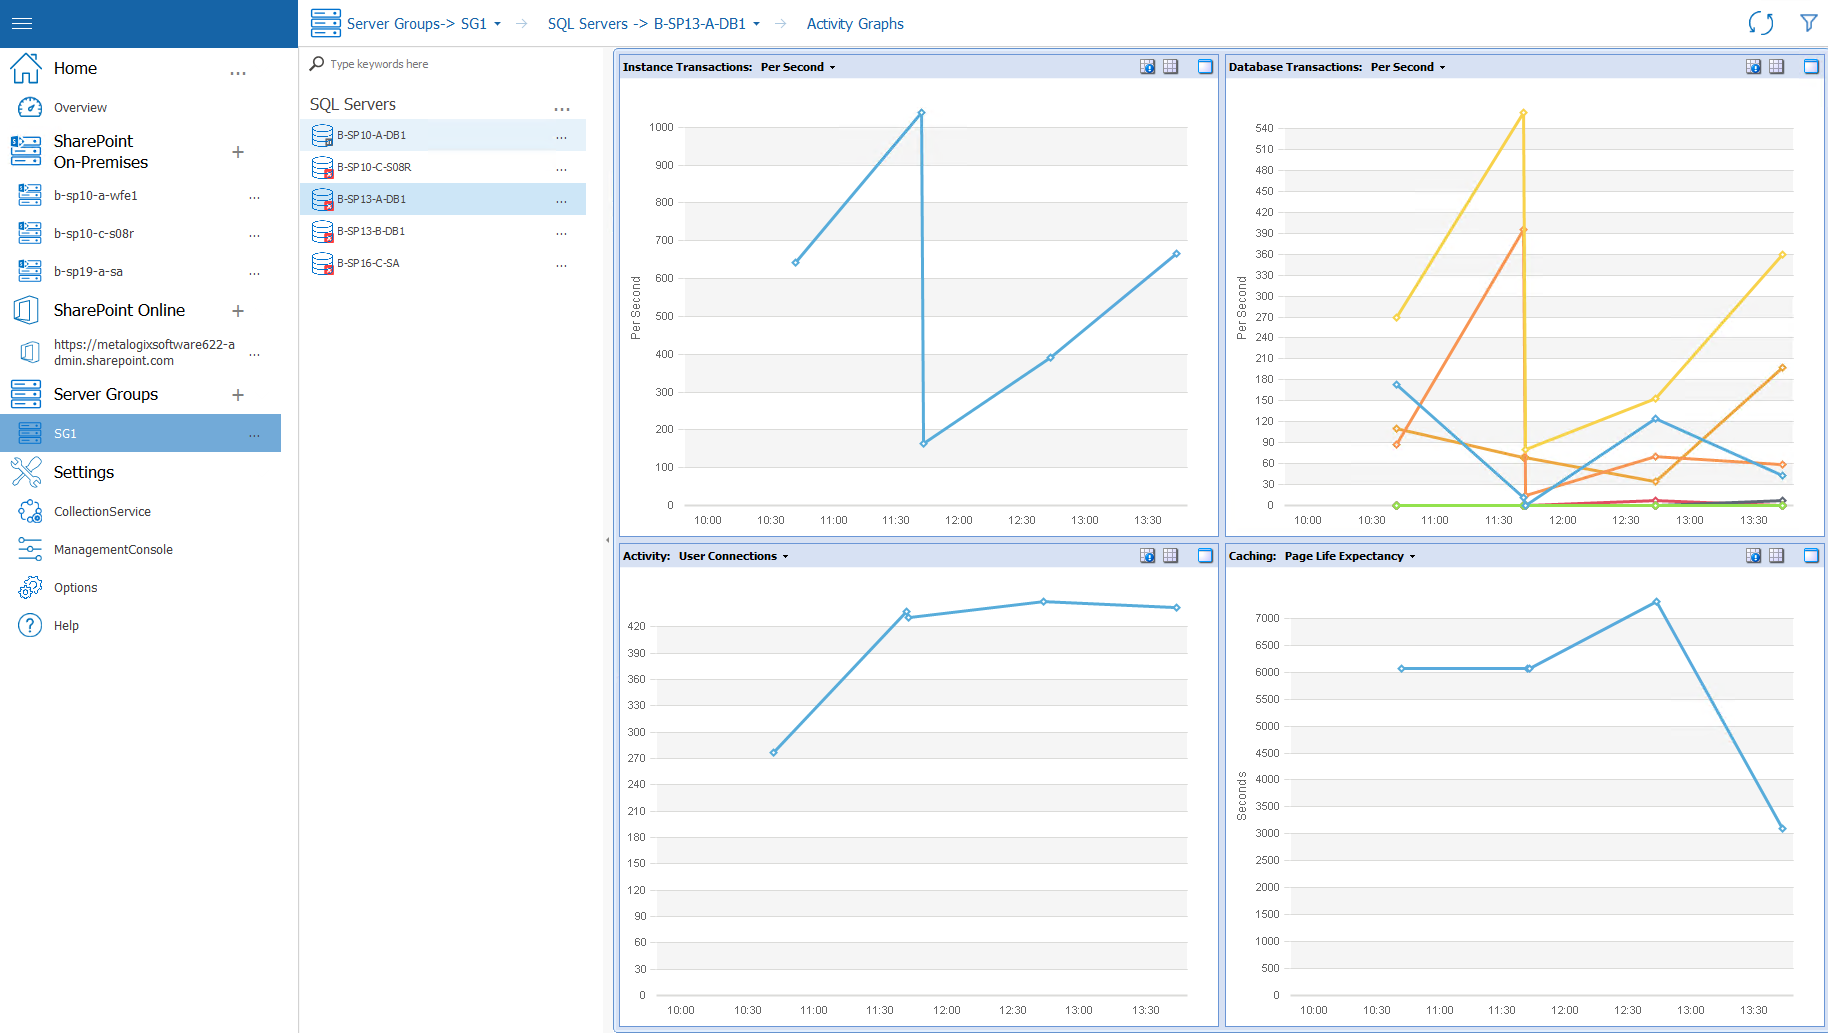
To View Activity Graphs for a single SQL Server:
1.In the Management Console tree, select the farm whose SQL Servers you want to view.
2.Select the name of the farm above the overview pane, this will provide a drop down panel, select SQL Servers.
3.Double Click on the SQL Server whose dashboard you want to view. Select the SQL Server's name above the viewing pane, and select Activity Graphs from the drop down panel.
4.This will open the Activity Graphs Page
To View Resources Graphs for a single SQL Server:
1.In the Management Console tree, select the farm whose SQL Servers you want to view.
2.Select the name of the farm above the overview pane, this will provide a drop down panel, select SQL Servers.
3.Double Click on the SQL Server whose dashboard you want to view. Select the SQL Server's name above the viewing pane, and select Resources Graphs from the drop down panel.
4.This will open the Resources Graphs Page.
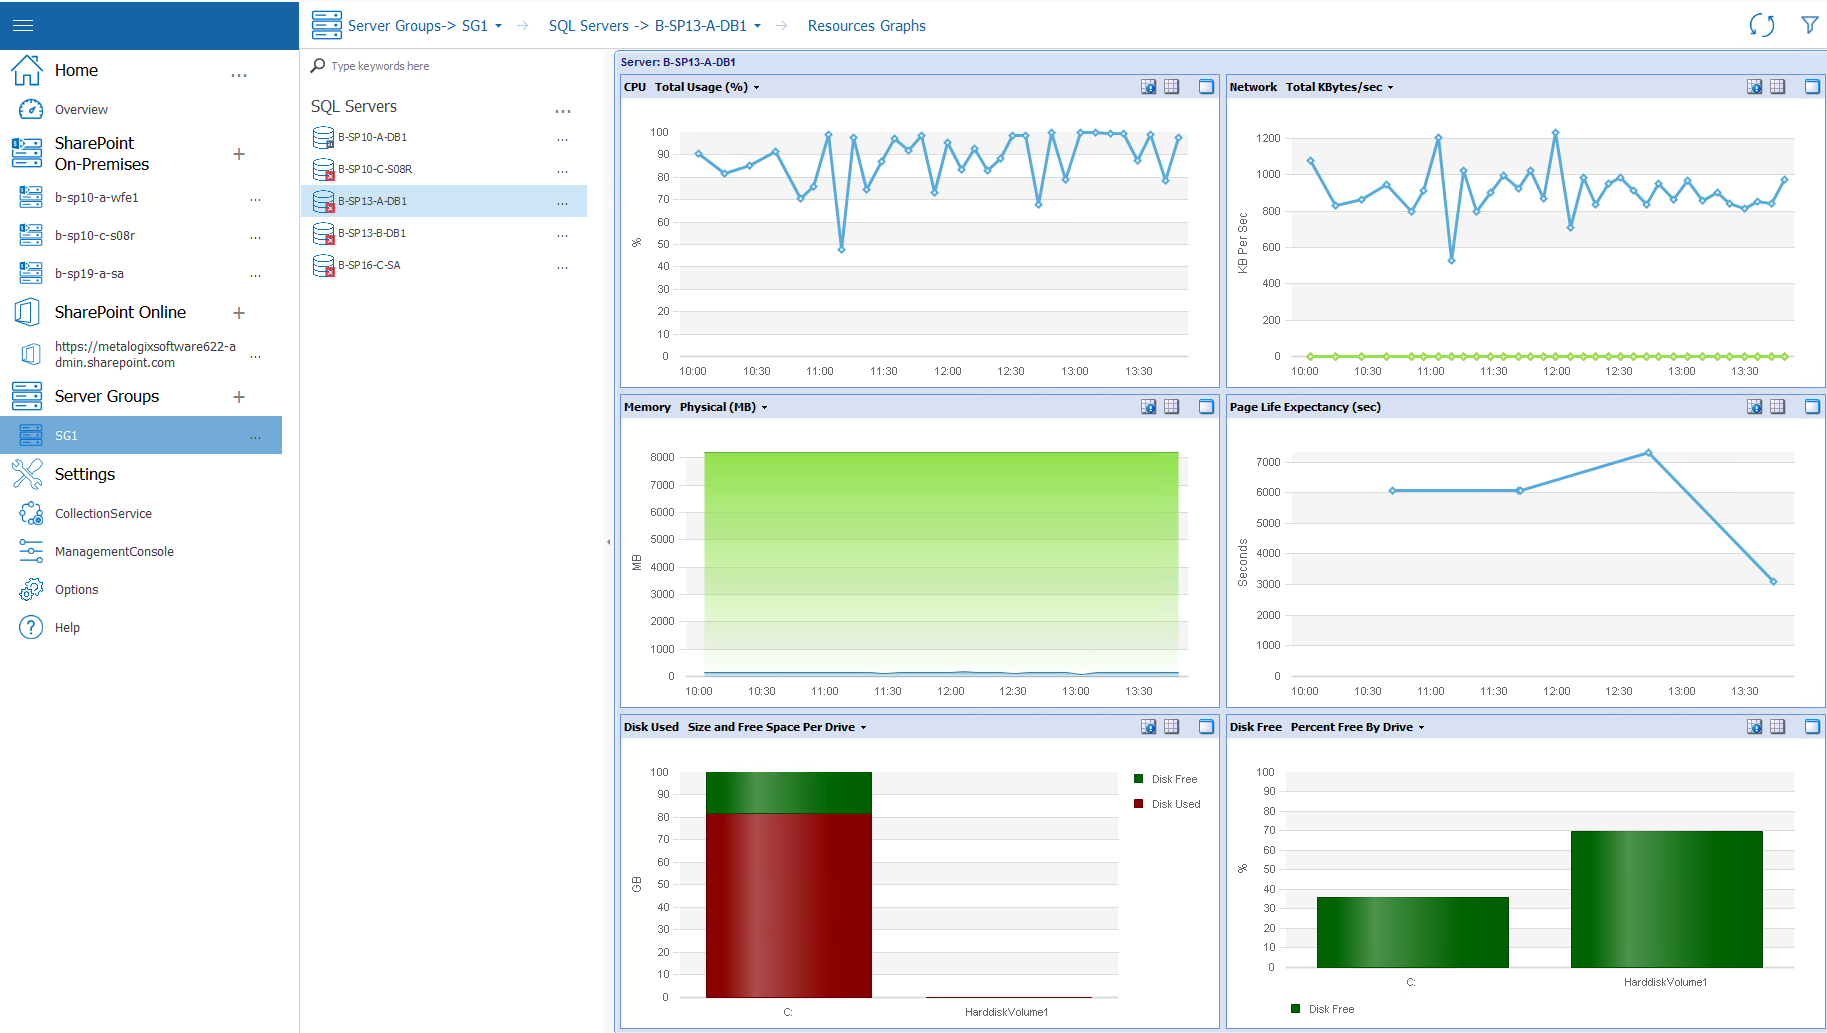
The data that populates these graphs is collected by Server Performance data collection (which, by default, runs every six minutes). The graphics will be refreshed according to the auto-refresh schedule specified in the Management Console Preferences dialog.
Now you can:
·change the time and duration of displayed data, and
·view more details.
See Working with Graphical Server Data for details.
Collecting Server Metrics Immediately
Metalogix Diagnostic Manager lets you immediately collect server performance metrics for all of the servers in a monitored farm.
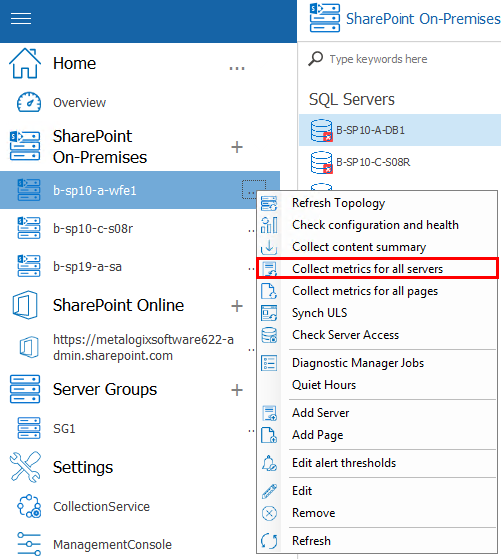
To collect server performance metrics for all servers in a farm immediately:
1In the Management Console select the farm whose server metrics you want to collect.
2Click the (...) next to the name and select Collect metrics for all servers.
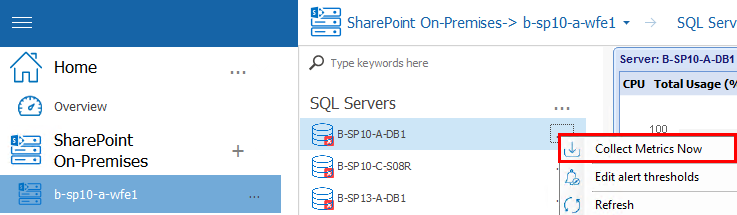
To collect server performance metrics for all servers in a farm immediately:
1.In the Management Console select the farm whose server metrics you want to collect, and the specific server for which you want to collect metrics.
2.Click the (...) next to the name and select Collect metrics now.
Monitoring SharePoint and Web Pages
Metalogix Diagnostic Manager helps you monitor the availability and load times of individual SharePoint pages, public Web pages, andif you are registered with Cloud Services Cloud pages. You can use alerts to help you find when a page needs your attention. You can set default alert thresholds for all pages or individual pages.
|
|
NOTE: For SharePoint on-premises pages, you can also monitor the components that make up the pages. |
To monitor a page, you first add a SharePoint on-premises farm or Server Group to Metalogix Diagnostic Manager. You can then add a page to monitor. After you have added a page, you can edit the monitored page settings as needed.
If you want to monitor Web pages from a machine that does not have internet access or if you want a secure connection, you can configure Web proxy settings.
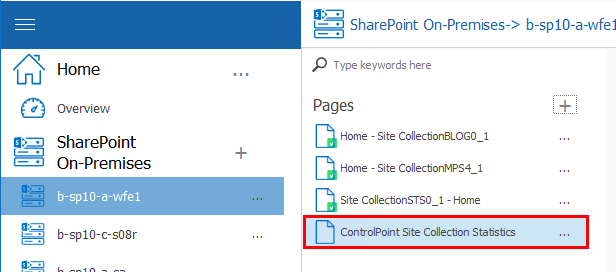
Adding a Page to Monitor
To add a page to monitor:
1.Use one of the following options:
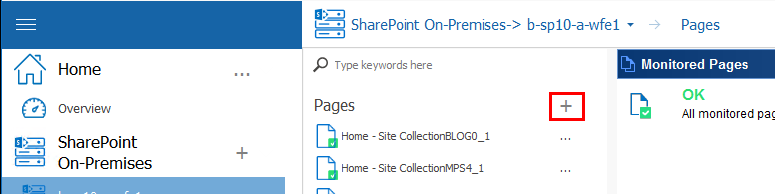
§In the Management Console tree, select the (...) next to the farm or server where you wish to add a page to monitor, and select Add Page.

OR
§In the Management Console tree, select the farm or server you wish to add a page to monitor to, once the overview pane for that farm opens, select the farm name above the pane, from the drop down panel, select Pages.
On this Page select the (+) symbol next to Pages, in order to add a page.

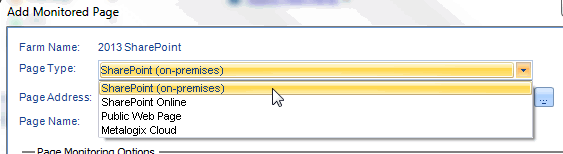
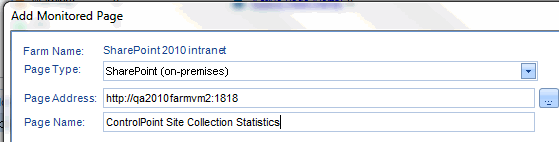
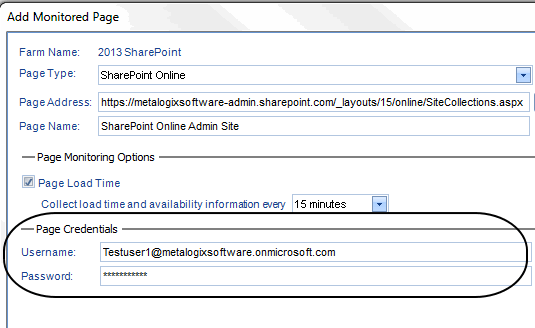
2.Select a Page Type:
§SharePoint (on-premises)
§SharePoint Online
§Public Web Page
§if you are registered for Cloud Services, Cloud.
3.For Page Address, either:
§Enter the full URL to the page you want to monitor.
OR
§Browse to the page as follows:
a)Enter the URL to the site that contains the page you want to monitor.
b)Click [...].
c)Click [Load Page] to display the Select Page To Monitor dialog.
d)Navigate to the page you want to monitor.
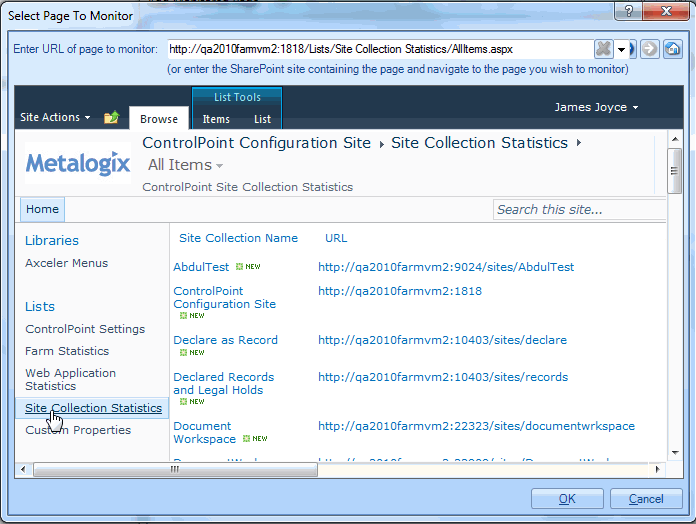
e)Click [OK].
4.In the Add Monitored Page dialog box, specify the Page name the Management Console should use for the page. If you used the browse option to locate the page, the page title is the default page name. You can change this default title, if necessary.
5.For Page Load Time, make sure the option is checked and, if different from the default (every 15 minutes), select the interval at which you want Metalogix Diagnostic Manager to check load time.
|
|
NOTE: You can check load time every minute, 15 minutes, or 60 minutes. |
6.Use the information in the table below to determine the appropriate next step.
|
If you are adding ... |
Then ... |
|---|---|
|
a page from a SharePoint On-Premises monitored farm |
specify additional Page Monitoring options. Note: Currently, you can only monitor Page Load Time for SharePoint Online, Public, and Cloud pages. |
|
a SharePoint Online or Cloud Web page |
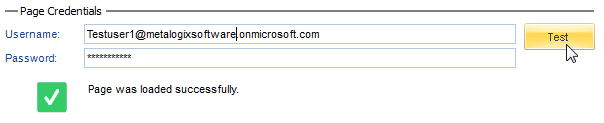
complete the Page Credentials section with the Username and Password you want Metalogix Diagnostic Manager to use to check page load time. If you want to validate the connection before adding the page, click [Test]. |
7.Click [OK].
The page now displays in the Pages section.