
Viewing the Status of a Single SQL Server
You can use the Metalogix Diagnostic Manager Management Console to view the status of individual SQL Servers in your SharePoint farm. In addition to SharePoint databases, you can monitor SQL System databases (master, tempdb, model, and msdb) as well as the Metalogix Diagnostic Manager Repository Database. You can also monitor SQL instances on manually added servers, regardless of whether they are associated with a SharePoint farm.
To view the SQL Server instance Dashboard
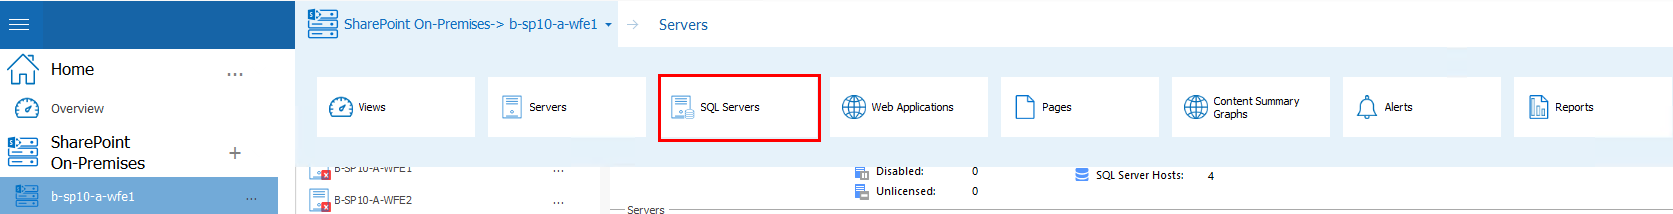
1In the Management Console tree, select the farm whose SQL Servers you want to view.
2Select the name of the farm above the overview pane, this will provide a drop down panel, select SQL Servers.
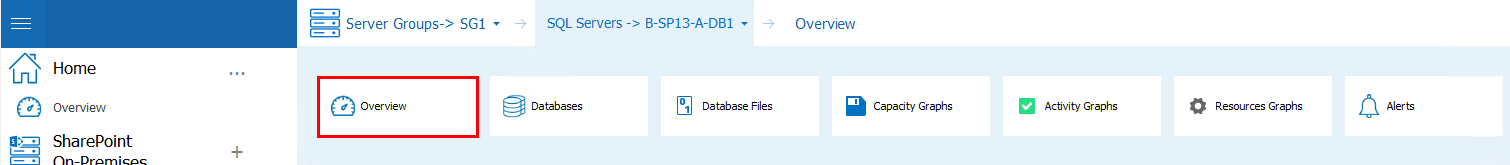
3Double Click on the SQL Server whose dashboard you want to view. If a view other than the overview pane opens, select the SQL Server's name above the viewing pane, and select Overview from the drop down panel.
The SQL Server dashboard contains the following information:
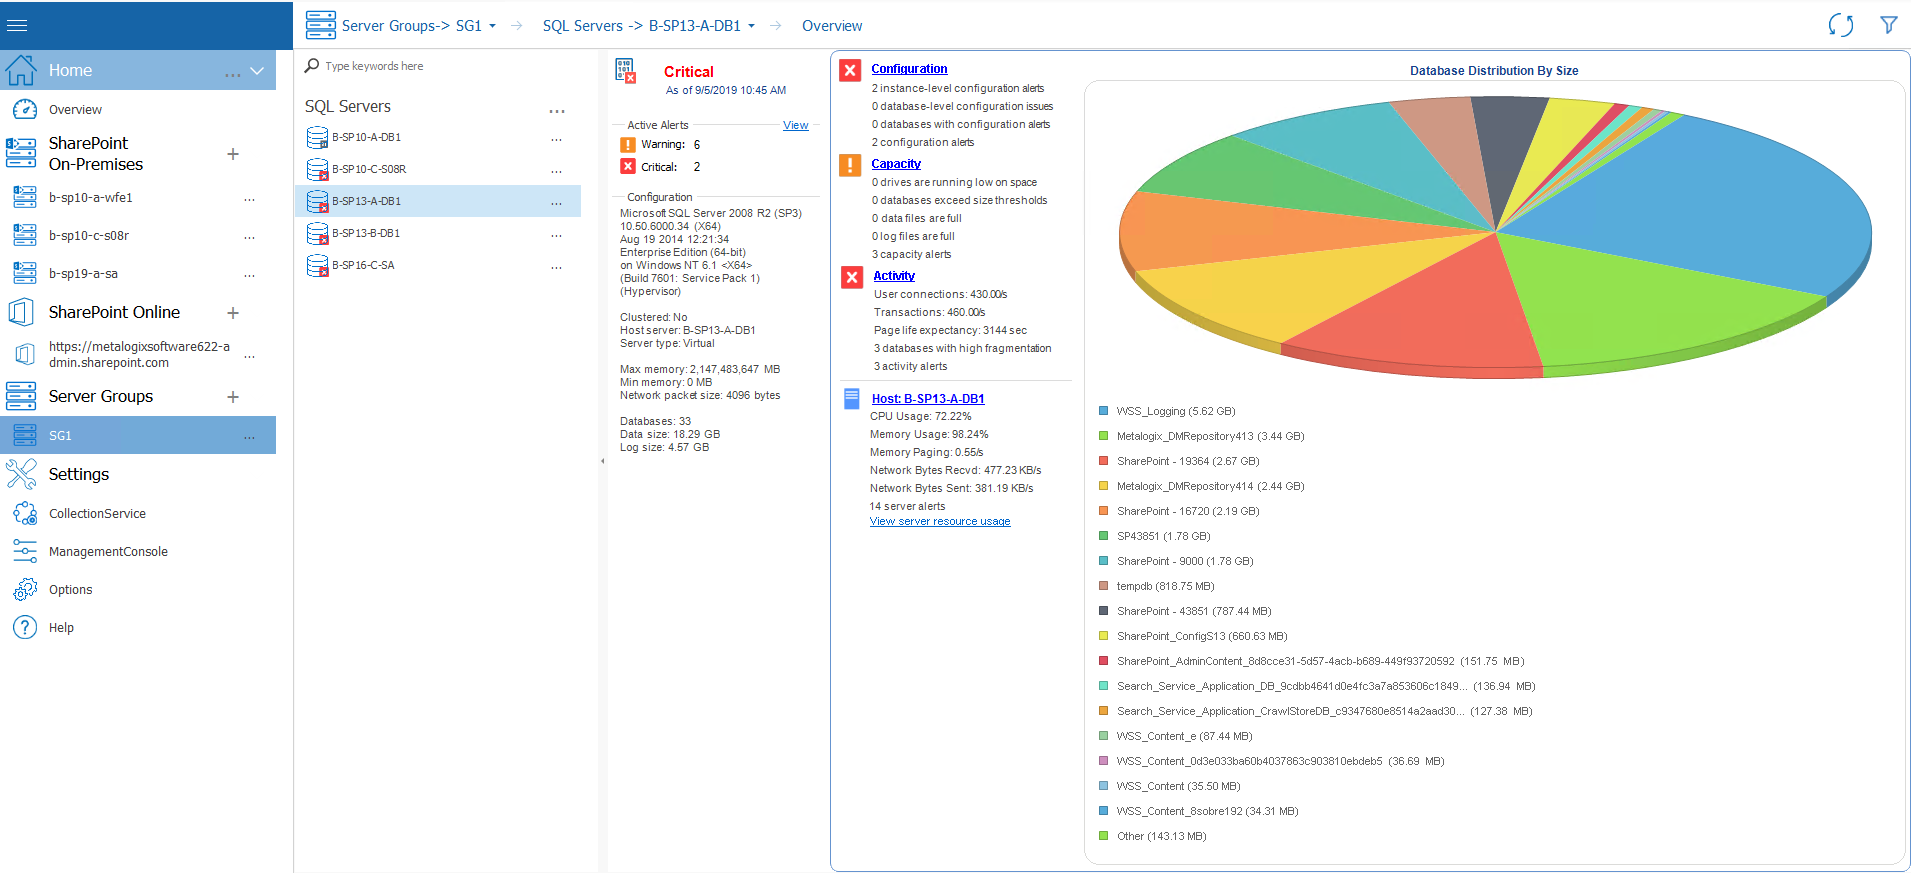
·The state of the selected server hosting SQL Server components.
·The total number of warning and critical Active Alerts for the selected server.
·Configuration information about the operating system, processors, memory, cluster status, and databases on the selected server.
·A dashboard view of the SQL Server. You can review the Configuration, Capacity, and Activity of the server.
·A view of the status of the Host server
·A pie chart that lets you visualize the Distribution of Databases by Size on the SQL Server.
Viewing the SharePoint Databases of a Single SQL Server
You can use the Metalogix Diagnostic Manager Databases to review information about the databases that the SQL Server instance hosts. The SharePoint databases table lists basic information about all of the databases.
To view SQL Server Database information:
1In the Management Console tree, select the farm whose SQL Servers you want to view.
2Select the name of the farm above the overview pane, this will provide a drop down panel, select SQL Servers.
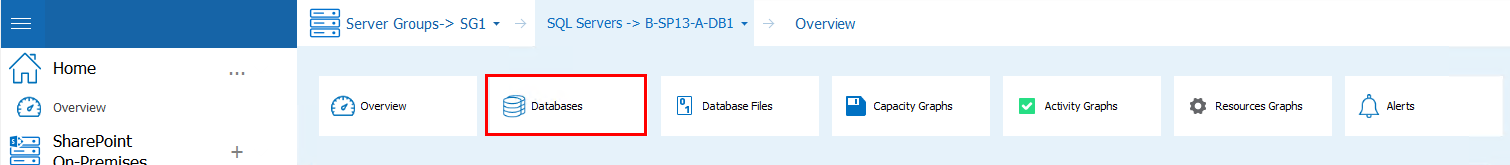
3Double Click on the SQL Server whose dashboard you want to view. Select the SQL Server's name above the viewing pane, and select Databases from the drop down panel.
The SQL Server Database view provides the following information about SharePoint databases on that server:
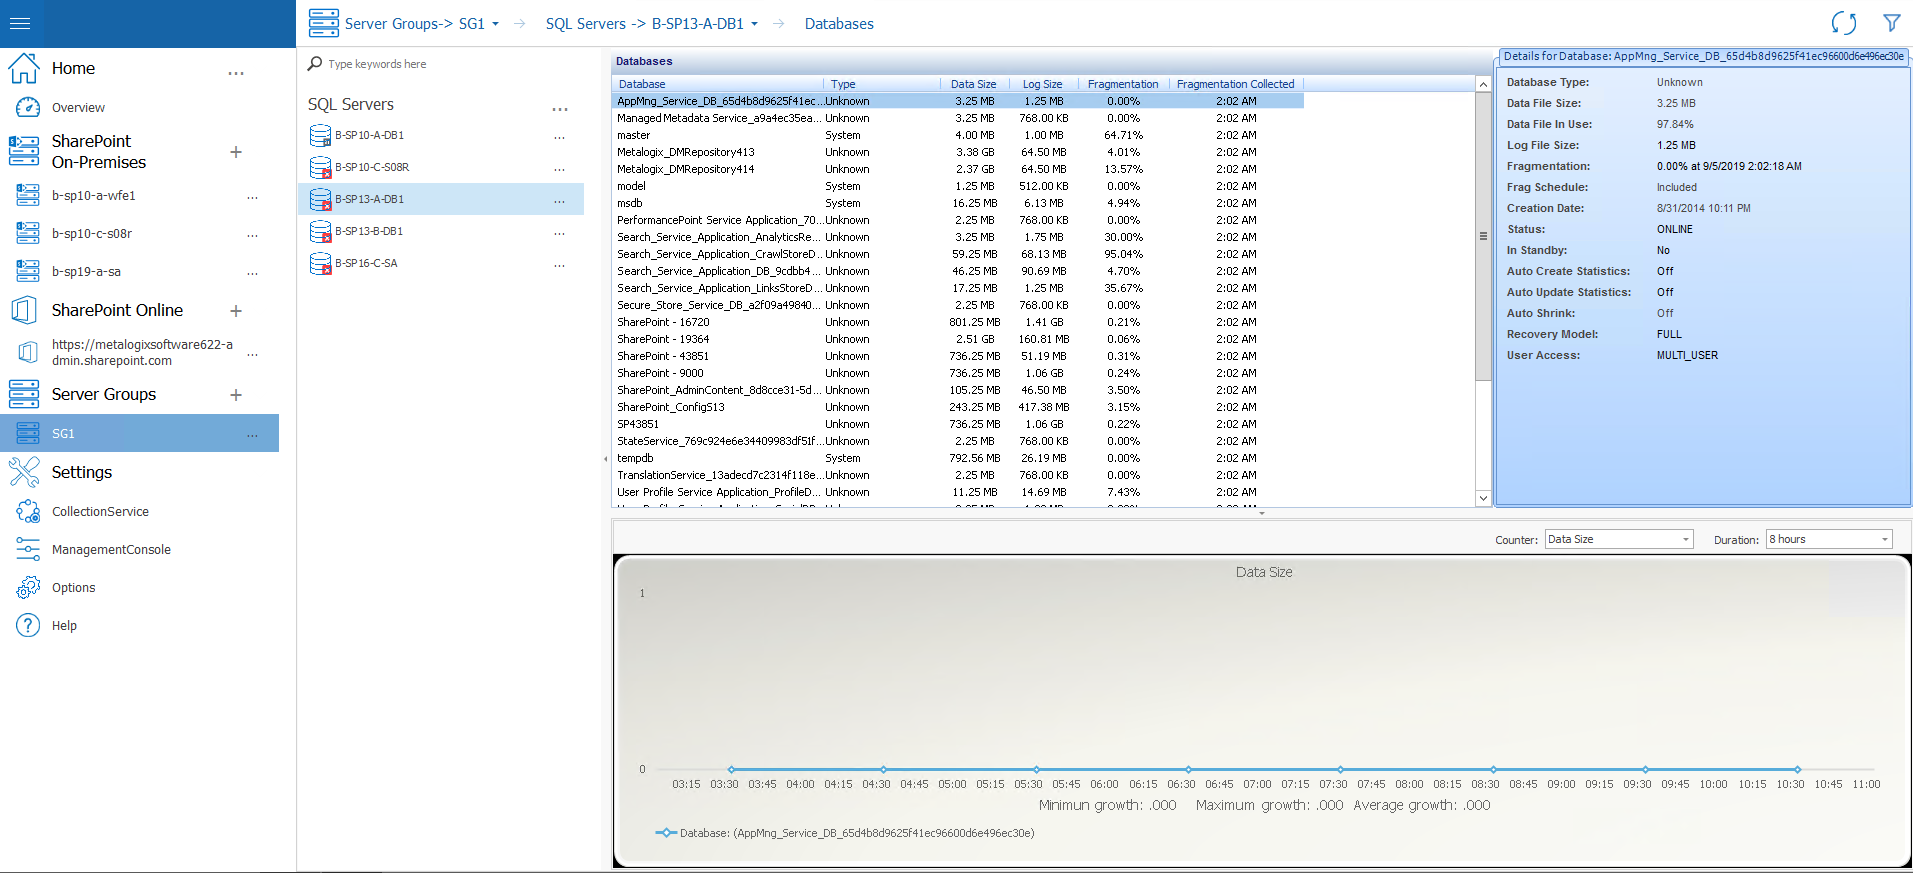
·Name of the Database as it appears in the SQL Server Management Studio.
·Database Type, such as Content, System, or Web Analytics.
·Data Size (the amount of memory used by the database)
·Log Size (the amount of memory used by the database log file)
·Percentage of database Fragmentation as of the Fragmented Collected timestamp.
·Date and time of the most recent database Fragmentation Collected.
·Total number of SharePoint Sites that store content in the database.
·For a selected database in the list:
-Additional database properties.
-A graphical view of growth for a selected database metric over a specified duration.
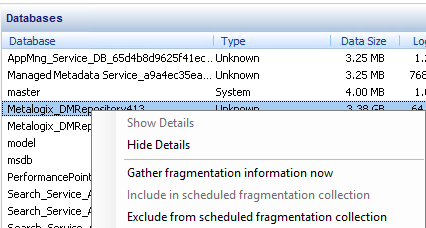
To exclude databases from the scheduled fragmentation statistics collection:
Select the appropriate database, right-click then choose Exclude from scheduled fragmentation collection.
You can have the database returned to the scheduled collection by choosing Include in scheduled fragmentation collection.
Viewing the Database Files of a Single SQL Server
The Metalogix Diagnostic Manager Database Files view lets you review individual files within the databases that the selected SQL Server instance hosts. The list includes all of the database files that the server hosts.
To view SQL Server Database Files:
1In the Management Console tree, select the farm whose SQL Servers you want to view.
2Select the name of the farm above the overview pane, this will provide a drop down panel, select SQL Servers.
3Double Click on the SQL Server whose dashboard you want to view. Select the SQL Server's name above the viewing pane, and select Database Files from the drop down panel.

The Database Files view includes the following information:
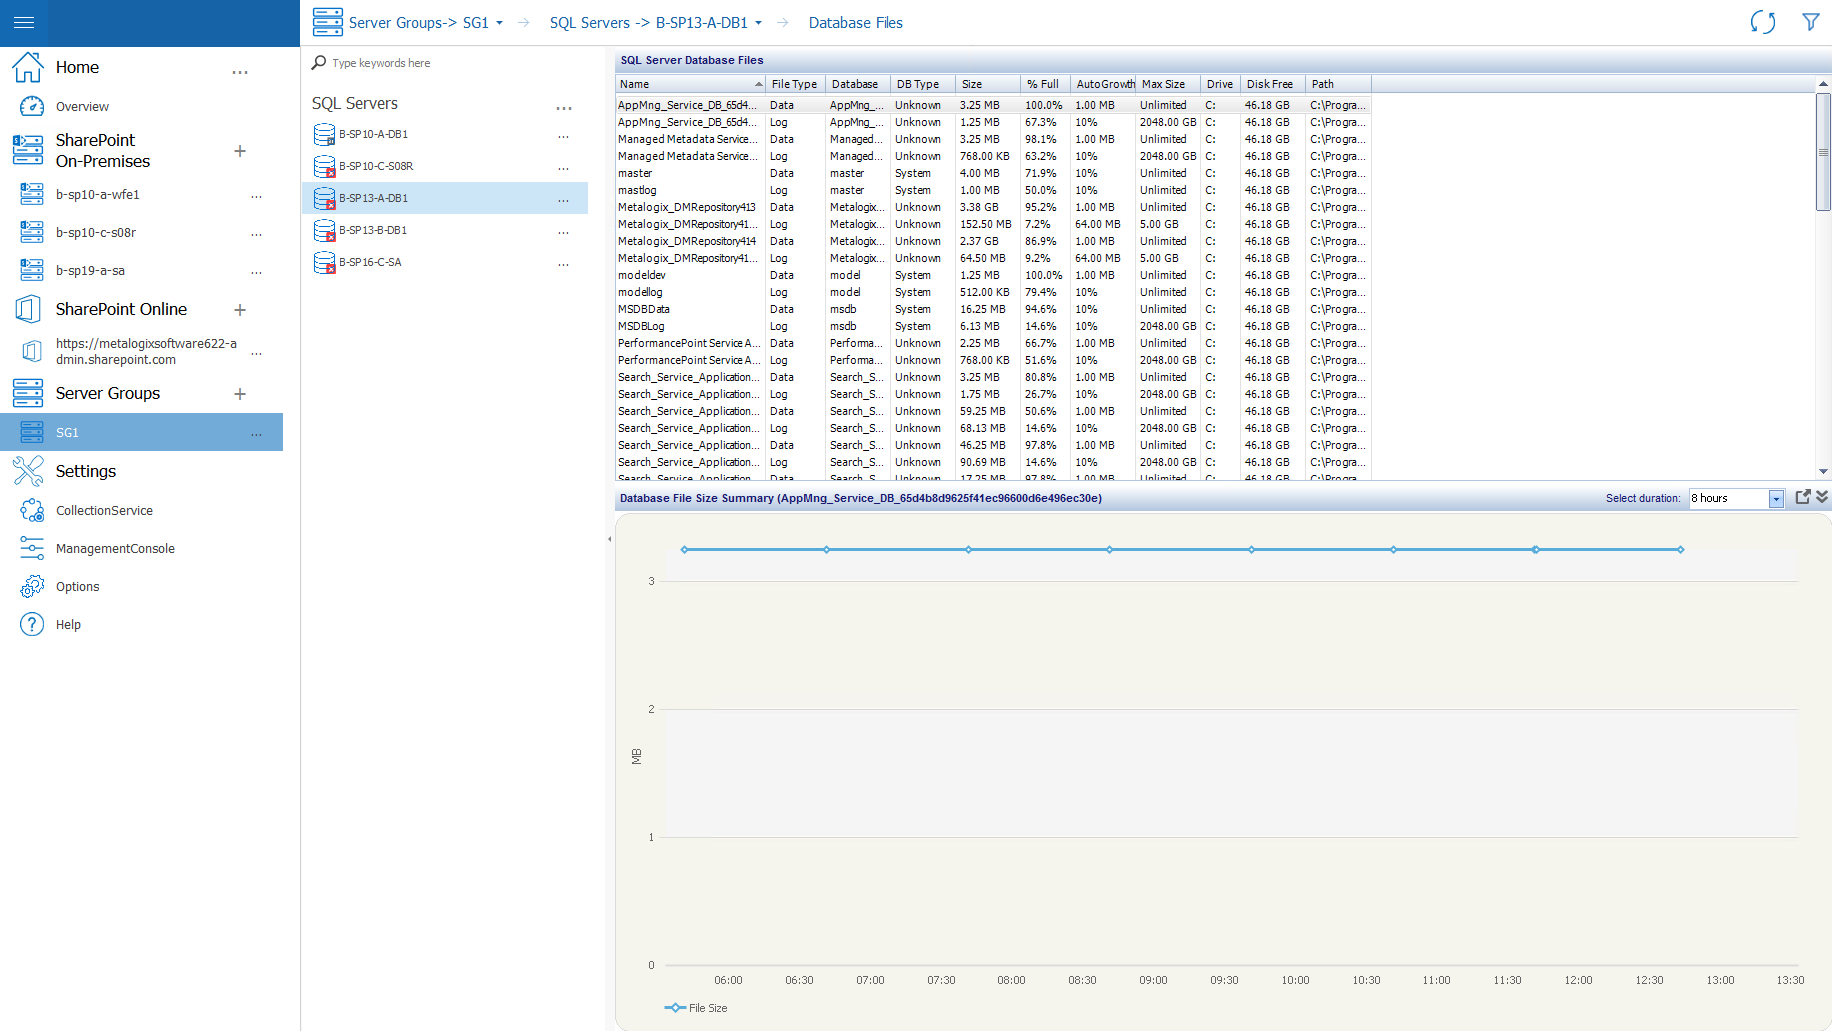
·Name of the database file
·Database File Type, such as data or log
·Name of the Database where the associated database file resides
·DB Type, such as Content, System, or Web Analytics
·Name of the SharePoint Web App for which this database file stores data
·File Size
·% Full (the percentage of the allotted memory used by the database file)
·Increment by which the database file grows if you enable Auto Growth for the database.
·Max Size allowed for the database file.
·Name of the Drive where the database file resides.
·Total amount of Disk Free space where the database file resides.
·Database file Path on the drive where the file resides.
·A graphical Database File Size Summary for a specified duration.
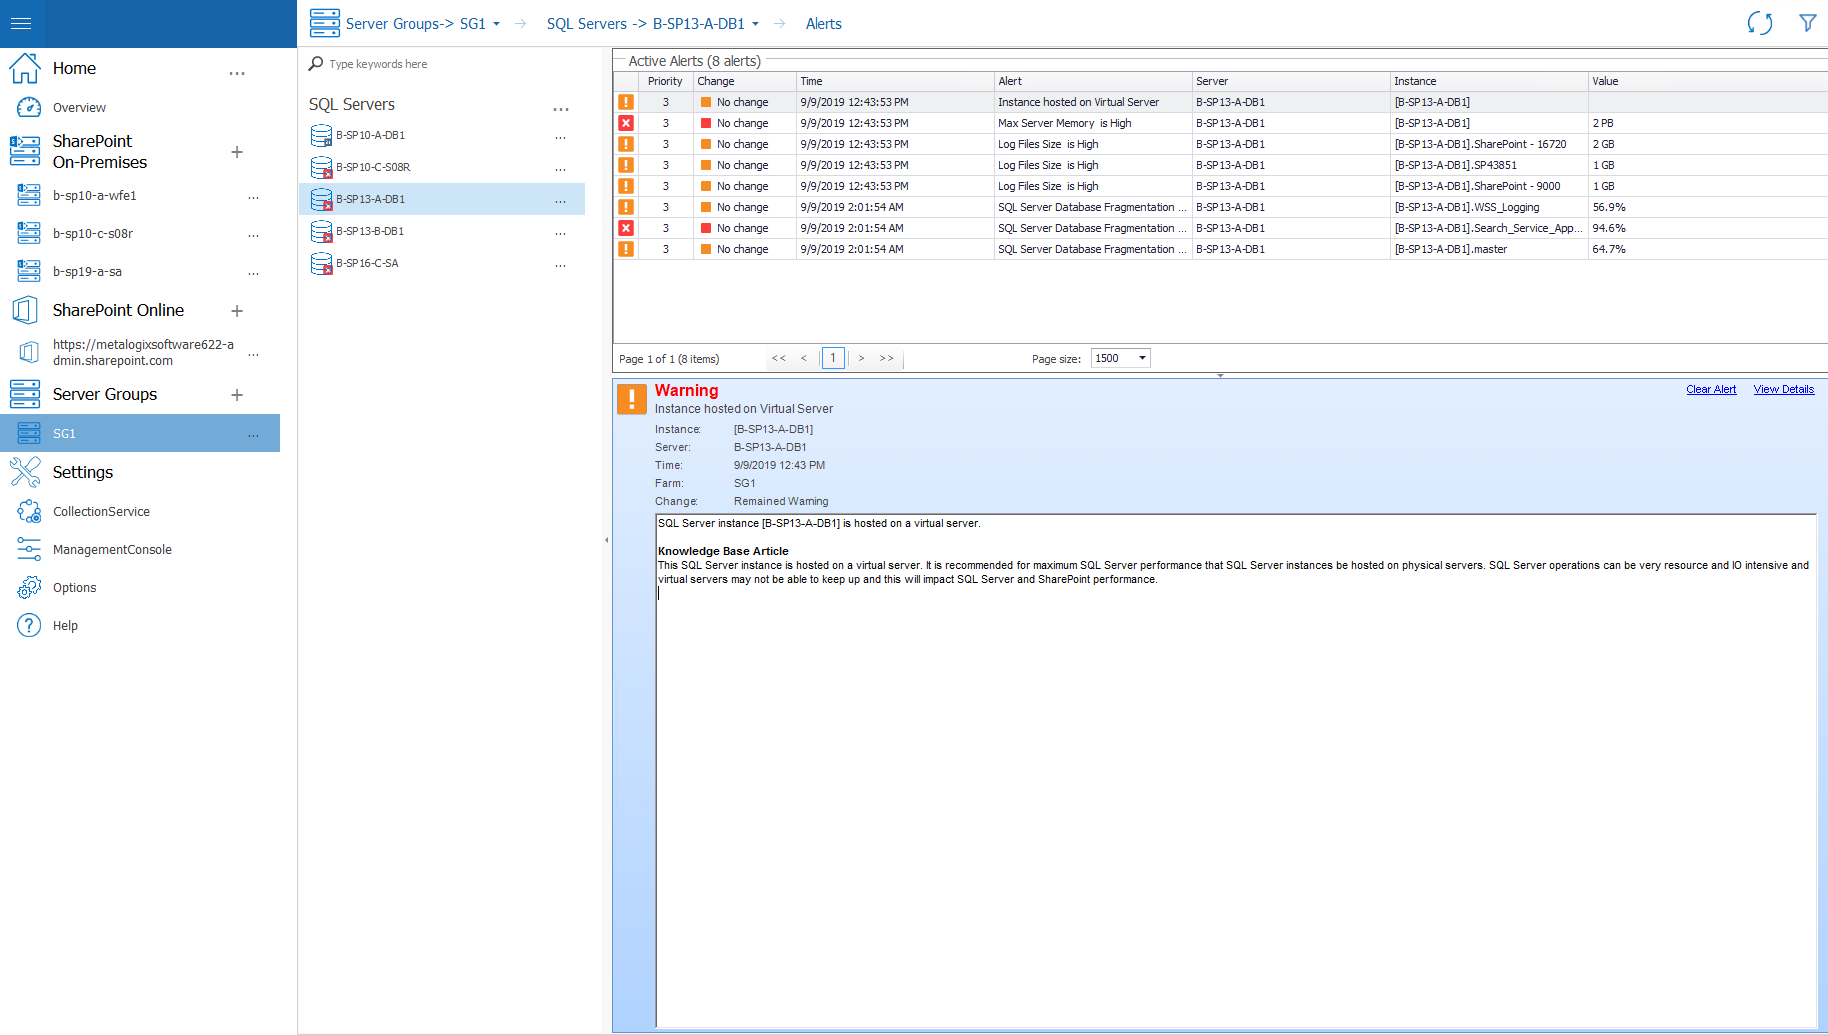
Viewing the Active Alerts for a Single SQL Server
Metalogix Diagnostic Manager allows you to see the active alerts for all of your SQL Server instances at once, or the alerts for a single SQL Server instance when necessary.
To view the active alerts for a server:
1In the Management Console tree, select the farm whose SQL Servers you want to view.
2Select the name of the farm above the overview pane, this will provide a drop down panel, select SQL Servers.
3Double Click on the SQL Server whose dashboard you want to view. Select the SQL Server's name above the viewing pane, and select Alerts from the drop down panel.
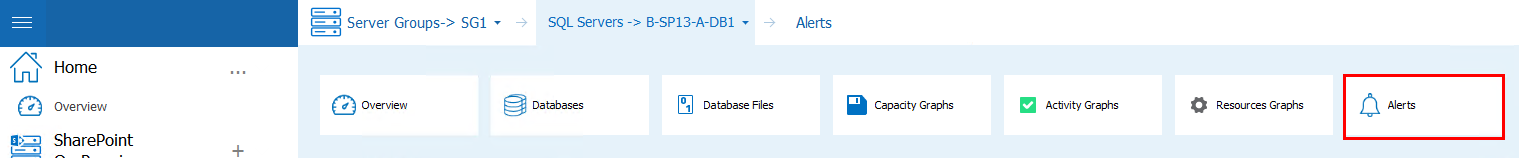
4This will open the Active Alerts window.
See also Using Alerts.