Viewing the Status of All the Servers in a Farm or Server Group
In the Servers view, Metalogix Diagnostic Manager provides a summary of the status of the servers that make up the farm, Server Group, or selected SQL Server Cluster Virtual Server. Metalogix Diagnostic Manager also provides for each server within the farm, Server Group, or virtual server:
·Server name
·Server type, such as physical or virtual
·Server status
·Number of critical alerts and warning alerts triggered from that server
·Status of the subsystems on that server
If you select a single farm, Metalogix Diagnostic Manager displays the following additional information:
·Information about the selected farm or Server Group, including the number of active alerts
·The servers configured as Web front end (WFE) servers.
To view the status of all of the servers in a farm, Server Group, or virtual server:
1.In the Management Console left hand pane, select the farm or Server Group whose servers you want to view. This will open the overview for that farm or server.
2.Select the farm or server name on top of the overview pane, and select Servers.
The multiple servers view lets you do the following:
·Refresh the server list.
·Add a server.
·Disable a server.
·Enable a disabled server.
·View server details.
If you are viewing all of the servers in a farm or Server Group, you can also do the following:
·Refresh the farm topology or "Servers Discovered" properties.
·View the active alerts for the farm or Server Group.
·Force immediate collection of the server metrics.
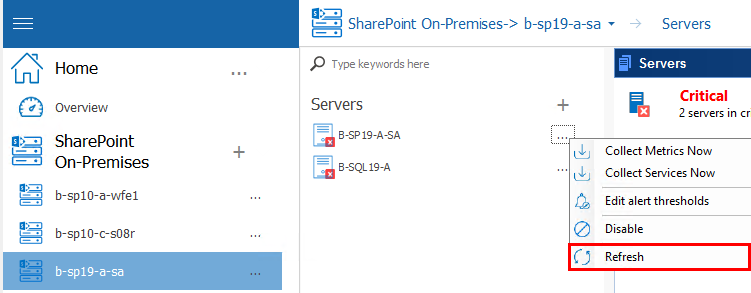
To refresh the server list:
Select the (...) next to the server you wish to refresh, and click Refresh.
The Management Console refreshes the multiple servers view with the most recent information about the server status and alerts.
|
|
NOTE: When you refresh the multiple servers view, only the servers for the selected farm, Server Group, or virtual server are refreshed. |
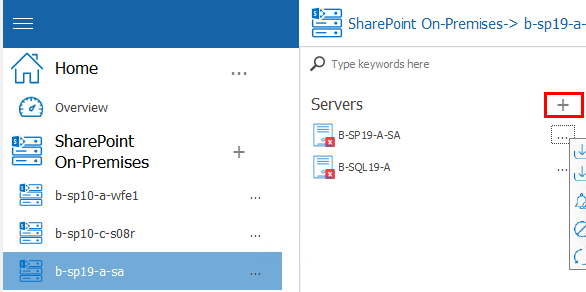
To add a server to monitor:
1.In the Servers section of the screen, choose + next to "Server" to add a new server.
2.In the Servers dialog box, enter the name of the server to add, then click [OK].
|
|
NOTE: Metalogix Diagnostic Manager uses the credentials of the account that was specified for data collection at the farm/Server Group level. |
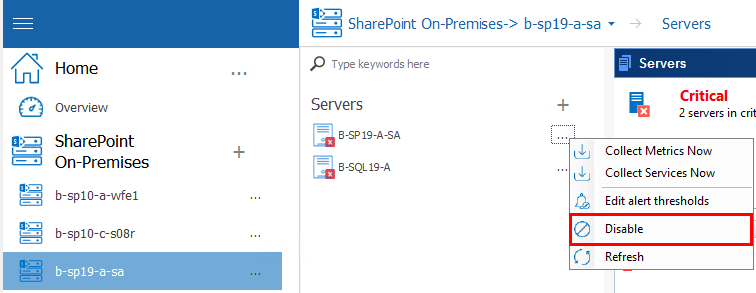
To disable data collection for a server:
1.In the multiple servers view, select the server you want to disable (see Temporarily Suspending Data Collection).
2.Select the (...) next to the server name, and select Disable from the drop down list.
You will be prompted to confirm the action before continuing.
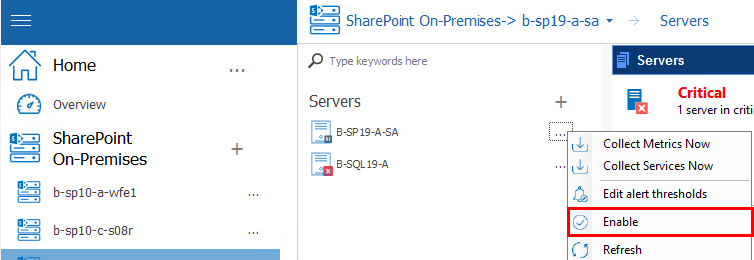
To enable data collection for a disabled server:
1.In the multiple servers view, select the disabled server you want to enable.
2.Select the (...) next to the server name, and select Enable from the drop down list.
The Management Console enables data collection for the server.
To view the details of a server:
1.In the multiple servers view, select the server whose details you want to view.
2.Select the server name on top of the overview pane and select Details.
Stopping and Starting Application Pools
You can stop and start application pools for a monitored server as long as the Collection Service is installed on a machine that has IIS installed and the Collection Service account has local administrator privileges.
To stop or start an application pool:
1.From the Management Console, open the servers for the farm or server group that contains the server that contains the application pool you want to stop or start.
2.Select the server that contains the application pool you want to stop or start, then click on its name above the overview pane, and select Web from the ribbon.
3.Select Application Pools from the top top pane.
4.Select the application pool you wish to start or stop, right-click and choose Start Application Pool or Stop Application Pool.
Viewing the Status of Individual Servers in a Farm or Server Group
You can use Metalogix Diagnostic Manager to view the status of each of the servers that make up your SharePoint farm or Server Group. The Server Overview displays the status of the components that the server hosts, including Internet Information Server (IIS) components.
Metalogix Diagnostic Manager provides the following information in the Server Overview view:
·the total number of warning and critical Active Alerts for the selected server
·the Status by Area for each server component that Metalogix Diagnostic Manager monitors.
·Configuration data, which includes information about the operating system, processors, memory, and other software installed on the selected server. This area also displays whether the server is a physical or virtual server.
·A graphical view of Recent Trends for the selected server
·Overall metrics for Resources, SQL Server, SharePoint, and Network/ IIS / Web Services
When Server Data is Collected
The Metalogix Diagnostic Manager Collection Service retrieves data from a server on a schedule that you specify in the Collection Service Options dialog. By default, the Collection Service retrieves data every six minutes.


