-
标题
Monitoring SQL Server ad-hoc query use and abuse -
解决办法
This article will provide an overview of ad-hoc query use in SQL Server, the potential resulting problems as well as how to detect and remediate them.
Background
Despite the many warnings about ad-hoc queries vulnerability to SQL injection attacks and the potential performance degradation compared to use of stored procedures, ad-hoc queries are still used quite a bit. For developers, the ad-hoc query is more flexible and more familiar than compiling the stored procedures since it allows them to create the string using concatenation easily, and execute it against the database. For example:
var adhocQuery = "SELECT * FROM test_table WHERE id = " + UserId ;
Ad-hoc queries are dynamic aka “on the fly” queries that are treated entirely different queries by SQL Server for every execution. The side effect of ad-hoc queries is that SQL Server does nor reuse such statements and instead it adds those to the procedure cache. As a consequence, on a system with significant traffic intensity, this can cause that procedure cache became bloated causing flushing the data from the buffer cache and thus forcing the SQL Server to read more data straight from the physical disk instead of from memory. The result could be a severe performance problem that can slow down SQL Server severely due to a created I/O bottleneck
Now, an ad-hoc query is not something that have to be avoided in all cases, and occasional use can be legitimate, but one should avoid to use them in some iterative cursor or RBAR (Row By Agonizing Row) processes
To illustrate the ad-hoc query check the following T-SQL (it can easily find its use in everyday work for testing purposes as well)
DECLARE       @tablesCount INT,
    @rowsCount INT,
    @tablename VARCHAR(100),
    @EMP_ID integer,
    @BIRTH_DATE date,
    @WAGE integer,
    @CREDIT_CARD integer,
    @EMP_NAME varchar(10)

SET @tablesCount = 0

WHILE (@tablesCount < 2) -- set the number of tables you want to be created
BEGIN
  SET @tablesCount = @tablesCount + 1
  SET @tablename = 'Table' + cast(@tablesCount as CHAR)

  PRINT 'Created table: ' + @tableName

  EXEC('CREATE TABLE ' + @tablename + '(
      EMP_ID integer,
      BIRTH_DATE date,
      WAGE integer,
      CREDIT_CARD integer,
      EMP_NAME varchar(10))')

  SET @rowsCount = 0

  WHILE (@rowsCount < 5) -- set the number of rows to be populated in each table
  BEGIN
    SET @rowsCount = @rowsCount + 1

    SET @EMP_ID = @rowsCount
    SET @BIRTH_DATE = DATEADD(d,-((18 * 365) + ABS(CONVERT(int,CONVERT(binary(4),NEWID())))/2147483648. * (47 * 365)),DATEADD(d,0,DATEDIFF(d,0,GETDATE())))
    SET @WAGE = CONVERT(int,50000 + ABS(CONVERT(int,CONVERT(binary(4),NEWID())))/2147483648.*90000)
    SET @CREDIT_CARD = CONVERT(int,5000000 + ABS(CONVERT(int,CONVERT(binary(4),NEWID())))/21474648. * 9000000)
    SET @EMP_NAME = REPLACE(REPLACE(REPLACE(REPLACE(REPLACE(REPLACE(REPLACE(REPLACE(REPLACE(REPLACE(CONVERT(varchar(10), ABS(CONVERT(int,CONVERT(binary(4),NEWID())))) ,'1','a'),'2','b'),'3','c'),'4','d'),'5','e'),'6','f'),'7','g'),'8','h'),'9','i'),'0','j')

    EXEC ('INSERT INTO ' + @tablename + ' VALUES (' +
      @EMP_ID + ', ' +
      '''' + @BIRTH_DATE + ''', ' +
      @WAGE + ', ' +
      @CREDIT_CARD + ', ' +
      '''' + @EMP_NAME + ''')')
  END
END
The query itself creates the desired number of tables in the database and populate each table with the desired number of rows with randomly generated data
The query uses dynamic SQL strings as for each variable in this query it hardcodes the generated value into that string. So, when the string (highlighted parts of the query) is executed using the EXEC command, the SQL Server must create a new query plan for every EXEC iteration because the string and values passed to the EXEC command are always different
So after executing the query (it creates 2 tables and then populates each with 5 rows of data), and as it can be seen it created 10 execution plans
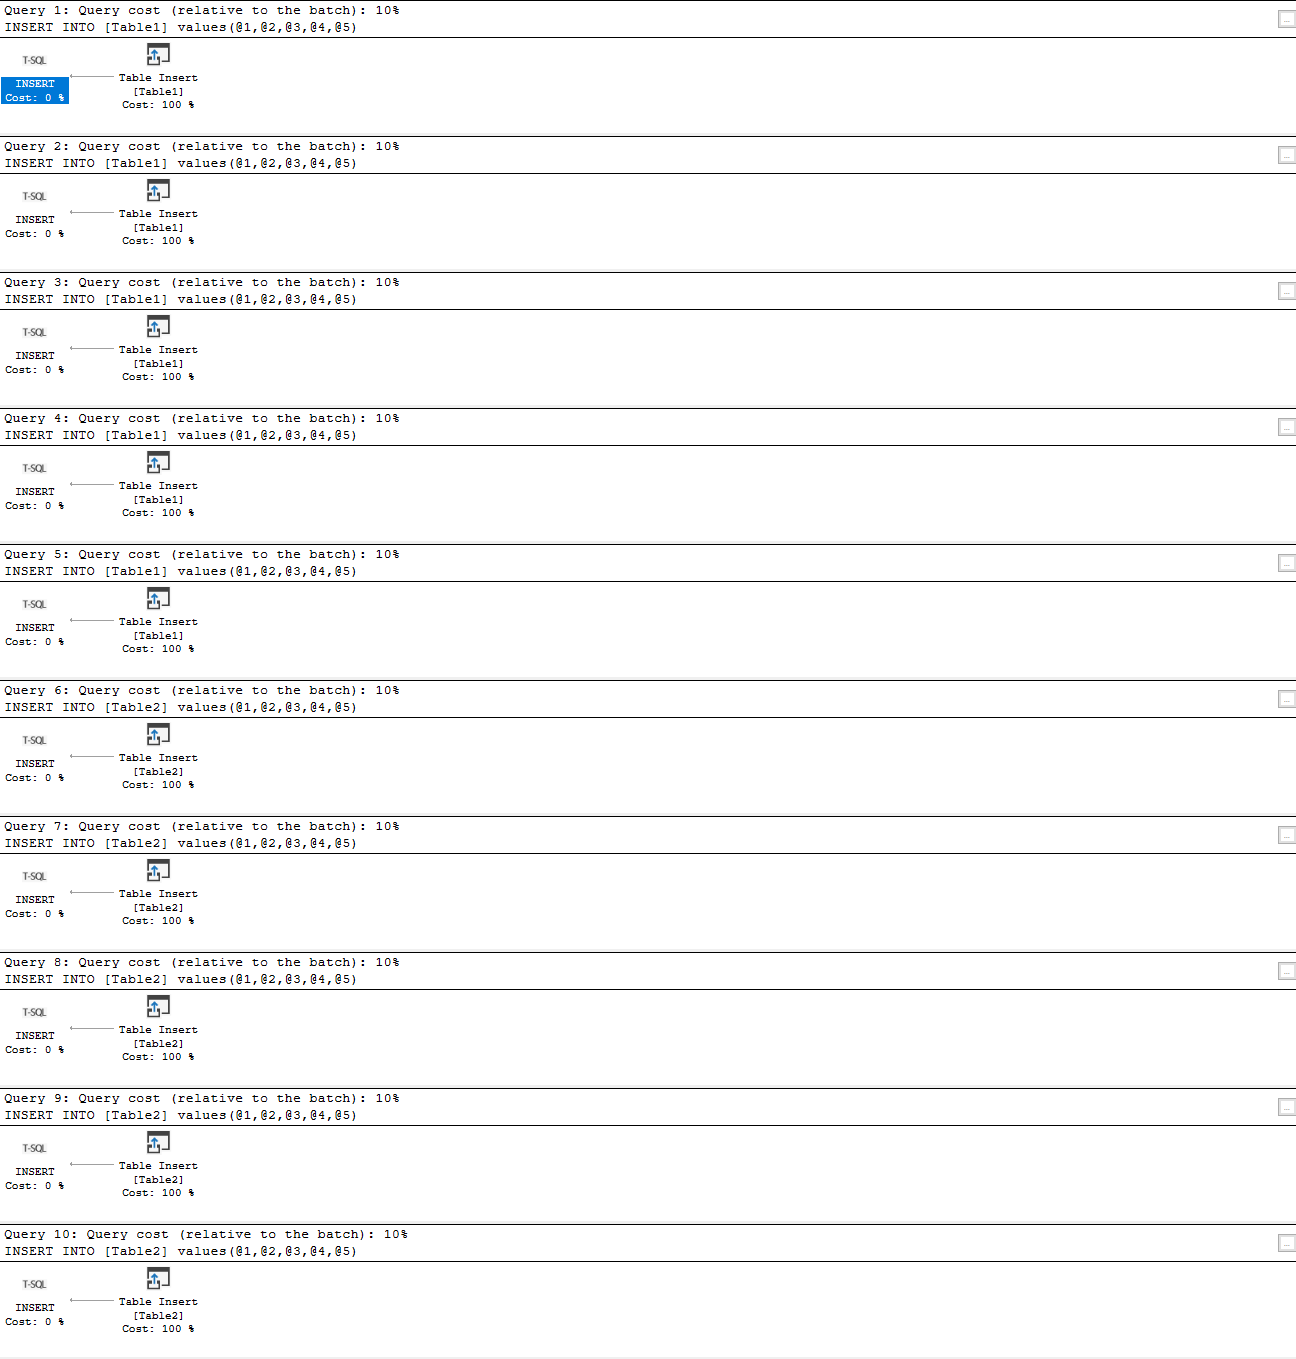
This query could be easily set to generate tens or hundreds of thousands of data rows (which will be demonstrated later in the article), and as a consequence ad-hoc queries could flood the execution plan cache with hundreds of thousands single-use copies of the very same query execution plan, where SQL Server has to involve additional work to compile and store each plan. That could severely affect the performance of SQL Server
Analyzing ad-hoc query cost and the impact on SQL Server performance
Generating a significant number of cached execution plans plan that are used only once takes up much space, wastes SQL Server resources and often results in SQL Server contention. Use of Performance Monitor counters could be the way to investigate the source of such issues.
Performance Monitor is a Windows performance monitoring tool suited with a broad range of metrics for monitoring performance of CPU, disk, memory, and network, but it is also equipped with a variety of SQL Server performance metrics.
Performance Monitor is a “live” tool that does not store the performance metric data anywhere, and therefore it is not always easy to track and compare performance data. One way is to create Performance Monitor snapshots at specified intervals and then to compare the results. So unless during the testing or in known situations, it is not a practical and reliable way of performing the analysis of the ad-hoc query issues
Another approach is using DMVs to analyze the impact of ad-hoc query use via analysis of the cached query execution plans and associated queries. All ad-hoc query execution plans are captured and stored in the plan cache, and by rule, the ad-hoc query creates the so-called single-use query execution plan.
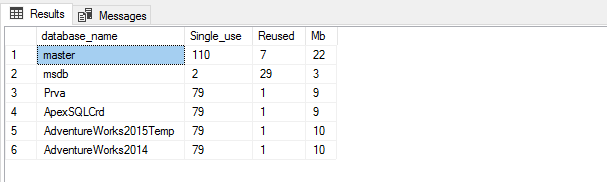
One approach to analyze ad-hoc query cost is determining the ratio between the multi-use and single-use query execution plans cached in SQL Server per each database
SELECT Db_Name(QueryText.dbid) AS database_name,
  Sum(CASE WHEN ExecPlans.usecounts = 1 THEN 1 ELSE 0 END) AS Single,
  Sum(CASE WHEN ExecPlans.usecounts > 1 THEN 1 ELSE 0 END) AS Reused,
  Sum(ExecPlans.size_in_bytes) / (1024) AS KB
   FROM sys.dm_exec_cached_plans AS ExecPlans
    CROSS APPLY sys.dm_exec_sql_text(ExecPlans.plan_handle) AS QueryText
   WHERE ExecPlans.cacheobjtype = 'Compiled Plan' AND QueryText.dbid IS NOT NULL
     GROUP BY QueryText.dbid;
Another way that can provide some insight into the potential issues related to the ad-hoc query use is to determine the percent of ad-hoc queries that are executed on the target SQL Server.
The following query can be used for that, and it returns the
SELECT Convert(INT,Sum
        (
        CASE a.objtype
        WHEN 'Adhoc'
        THEN 1 ELSE 0 END)
        * 1.00/ Count(*) * 100
              ) as 'Ad-hoc query %'
  FROM sys.dm_exec_cached_plans AS a
The example of the query result:

A single execution of this query indicates that 82% of queries executed on SQL Server are an ad-hoc query, so depending on the expected value and application design, such result could indicate that there is a need for closer inspection of the application design.
However, for getting some more reliable information regarding the potential ad-hoc query impact on SQL Server, this query should be scheduled and results collected and stored so that they can be analyzed and compared over the time. But none of those allow relevant and measurable analysis of the actual impact that ad-hoc query use imposes on SQL Server performance
Using ApexSQL Monitor to investigate potential issues with ad-hoc query use (and abuse)
It is not unexpected that plans stored in the plan cache could be used differently. While some query plans are used quite frequently, there are query plans used just a few times, or just once. The SQL Server cache management is efficient, and it allows occasional ad-hoc query use of without causing some overhead on SQL Server.
On the other hand, frequent and extensive ad-hoc query use could utilize SQL Server resources at the level that SQL Server cache management can’t handle efficiently. In such situations it is possible that SQL Server flushes from the cache some critical and frequently used query plans.
Apex SQL Monitor can track two most important metrics that are used as an indication of the issues related to ad-hoc query overuse and when the SQL Server is affected by ad-hoc queries: Compilations/sec and Batch Requests/sec
The Batch Request/sec metric is explained in details in the SQL Server performance counters (Batch Requests/sec or Transactions/sec): what to monitor and why article, so it won't be elaborated on further, in this article
The Compilations/sec metric indicates the number of query compilations and/or recompilations in a monitored SQL Server instance. When Compilations/sec metric reaches a high number, it could be an indication that SQL Server is under the high workload and that it is affected by more compilations and recompilation than it is expected or necessary. The high numbers of compilations could impose the overhead on SQL Server performance
However, Compilations/sec metric when used independently, even when it has high values, doesn’t tell whether the system is affected due to excessive ad-hoc query use, unless it is coupled with Batch Requests/sec
The general rule of thumb for the ratio between those two metrics is that Compilations/sec value should stay at up to 10% of the Batch Requests/sec value. 10% is just a guideline, and it should not be taken as an exact value that always indicates the issue if breached
ApexSQL Monitor tracks both SQL Server performance metrics and stores the metric values in the repository database, so the values of those metrics can be analyzed over various periods for various SQL Server performance behaviors
To access those metrics in ApexSQL Monitor for the monitored server:
-
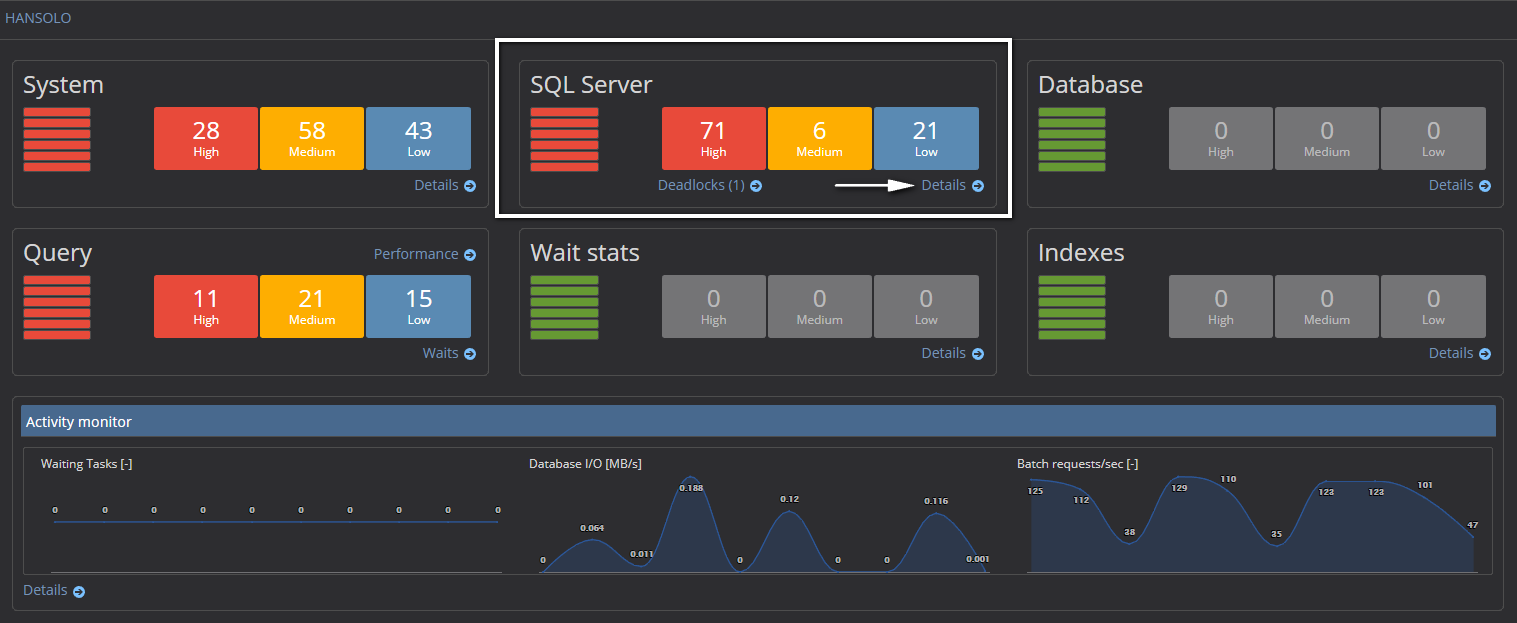
Select the desired SQL Server in the server explorer pane on the left side or click on the SQL Server name in the main dashboard. That will open the instance dashboard
-
In the SQL Server section click on the Details link to open the SQL Server metric charts page
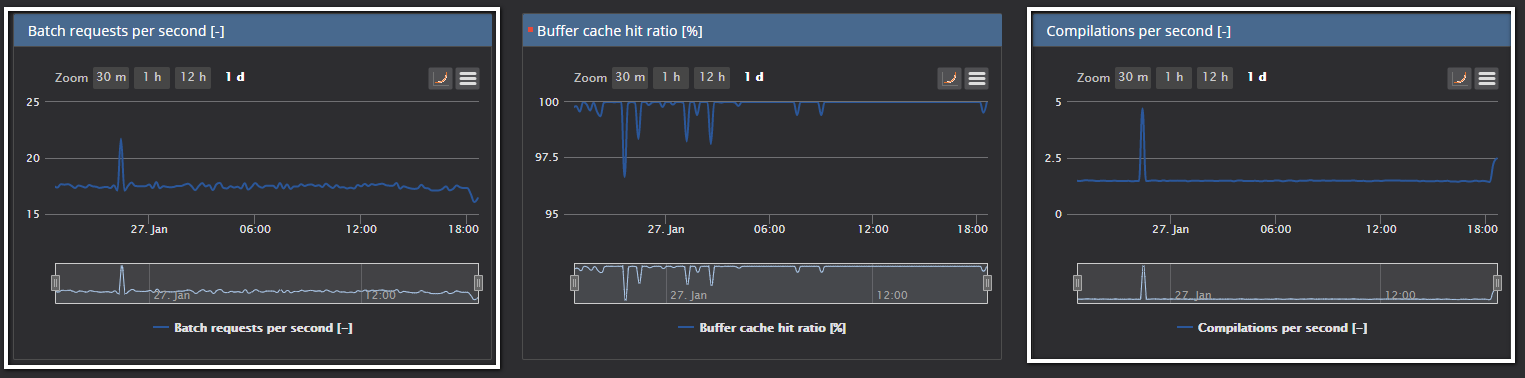
Charts for both metrics are located at the top of the SQL Server metrics page
When the SQL Server is in normal working condition, the chars should have some values that are close to the mentioned 10% rule of thumb
As it is already explained, values for those metrics could vary significantly depending on the system and the application design, so it is recommended to baseline those metrics. Baselining those metrics could provide much better insight into “good” and “bad” values
For this article, a bit extreme example will be presented to demonstrate the situation where the ad-hoc query would cause the pressure on SQL Server and performance degradation
The query that executes a significant number of ad-hoc queries by inserting the random data in tables will be used
DECLARE @tablesCount INT,
    @rowsCount INT,
    @tablename VARCHAR(100),
    @ZAP_ID integer,
    @DATUM_RODJENJA date,
    @PLATA integer,
    @CREDITNA_CARTICA integer,
    @IME_ZAP varchar(10)

SET @tablesCount = 0

WHILE (@tablesCount < 2) -- set the number of tables you want to be created
BEGIN
  SET @tablesCount = @tablesCount + 1
  SET @tablename = 'Table' + cast(@tablesCount as CHAR)

  PRINT 'Created table: ' + @tableName

  EXEC('CREATE TABLE ' + @tablename + '(
      ZAP_ID integer,
      DATUM_RODJENJA date,
      PLATA integer,
      CREDITNA_CARTICA integer,
      IME_ZAP varchar(10))')

  SET @rowsCount = 0

  WHILE (@rowsCount < 2000000) -- set the number of rows to be populated in each table
  BEGIN
    SET @rowsCount = @rowsCount + 1

    SET @ZAP_ID = @rowsCount
    SET @DATUM_RODJENJA = DATEADD(d,-((18 * 365) + ABS(CONVERT(int,CONVERT(binary(4),NEWID())))/2147483648. * (47 * 365)),DATEADD(d,0,DATEDIFF(d,0,GETDATE())))
    SET @PLATA = CONVERT(int,50000 + ABS(CONVERT(int,CONVERT(binary(4),NEWID())))/2147483648.*90000)
    SET @CREDITNA_CARTICA = CONVERT(int,5000000 + ABS(CONVERT(int,CONVERT(binary(4),NEWID())))/21474648. * 9000000)
    SET @IME_ZAP =  REPLACE(REPLACE(REPLACE(REPLACE(REPLACE(REPLACE(REPLACE(REPLACE(REPLACE(REPLACE(CONVERT(varchar(10), ABS(CONVERT(int,CONVERT(binary(4),NEWID())))) ,'1','a'),'2','b'),'3','c'),'4','d'),'5','e'),'6','f'),'7','g'),'8','h'),'9','i'),'0','j')

    EXEC ('INSERT INTO ' + @tablename + ' VALUES (' +
      @ZAP_ID + ', ' +
      '''' + @DATUM_RODJENJA + ''', ' +
      @PLATA + ', ' +
      @CREDITNA_CARTICA + ', ' +
      '''' + @IME_ZAP + ''')')
  END
END
The query creates two tables and populates each table with 2,000,00 rows using a dynamic ad-hoc query
Now, let’s see how the SQL Server behaves when the above query is executed
Before it is executed, the look at the SQL Server metric reveals the quite normal situation with both metrics that we are monitoring
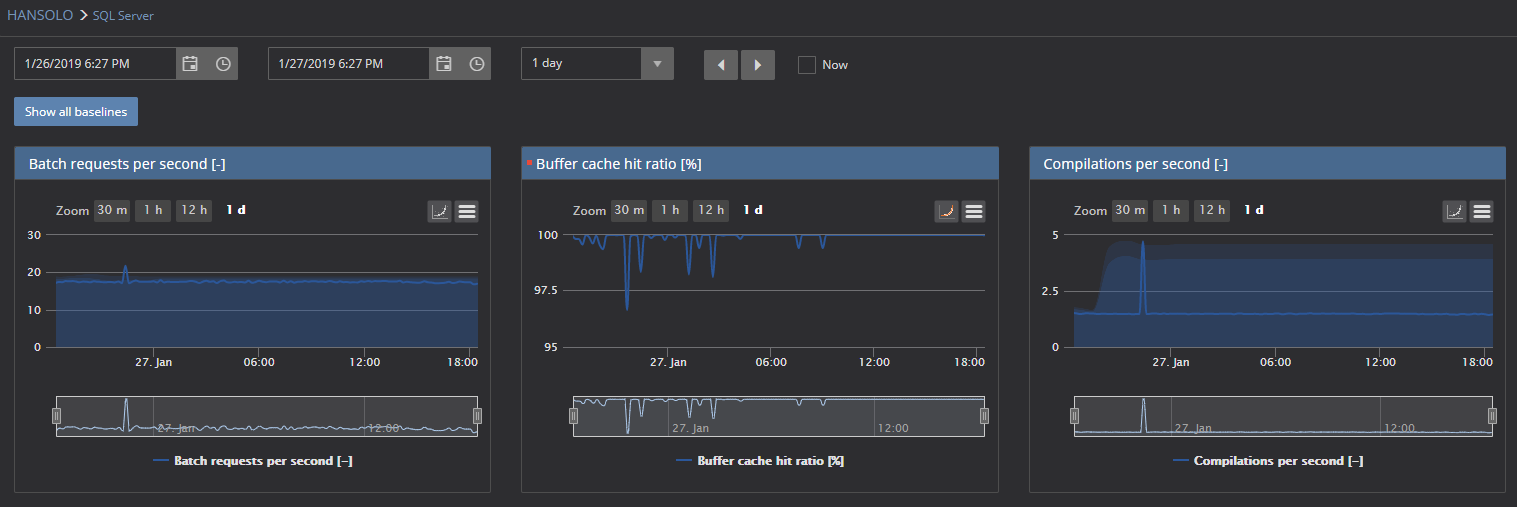
The shot displays the period of 1 day period in charts, and as it can be seen, all values are within the calculated baselines.
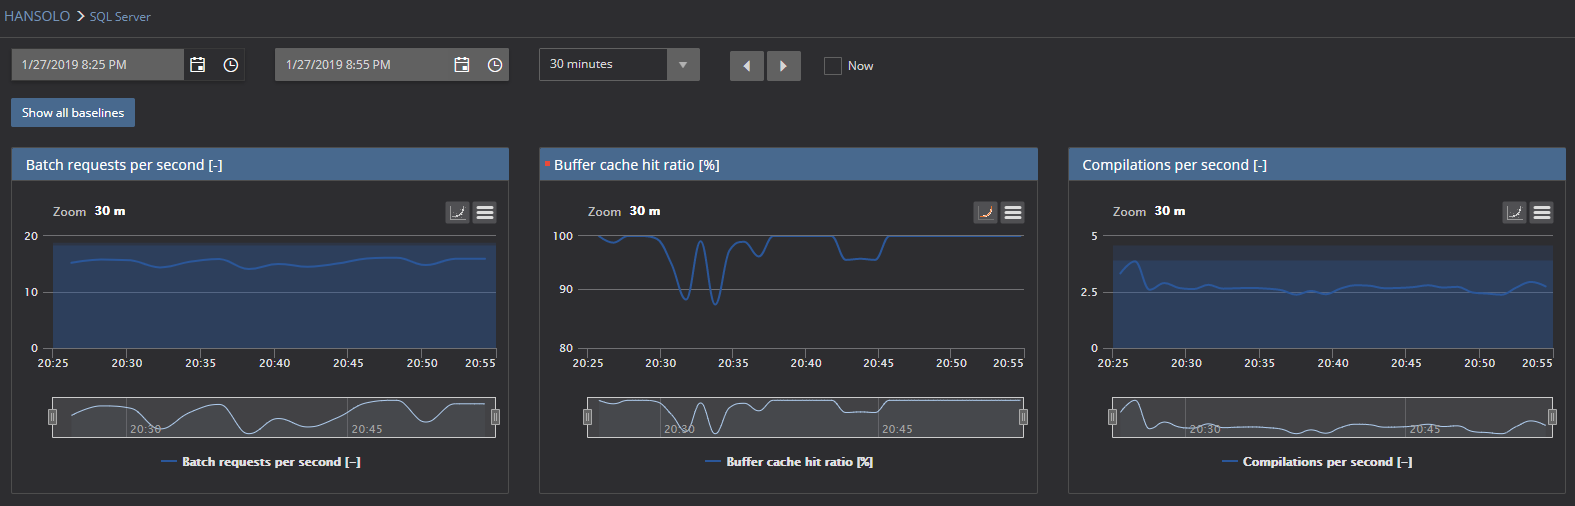
A close look at the 30 minutes chart reveals the same situation for both metrics.
Now, we will execute the query and wait some time until it executes. After some 30 minutes of collecting the metrics, data let’s check the charts again
Moreover, now we have a significantly different situation. Pay attention to the values of Compilations per second metric. Values are around 9,000 compilations per second, while at the same time Batch requests per second values are more or less similar and within the calculated baseline
A closer look at each metric …
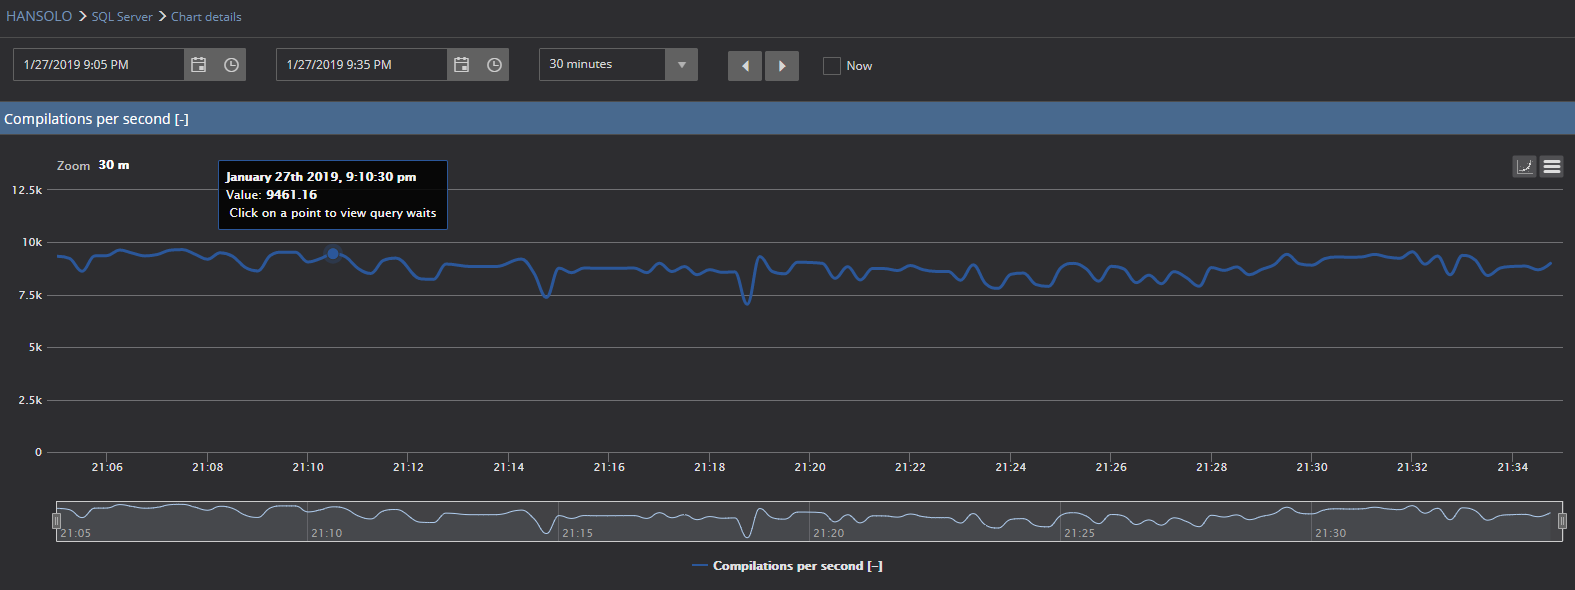
It is evident that in this particular case, the Compilations per second chart cannot even display the baseline due to very high values caused by the executed query
If we select the time frame that covers the period before and after the query execution, we can notice the following situation
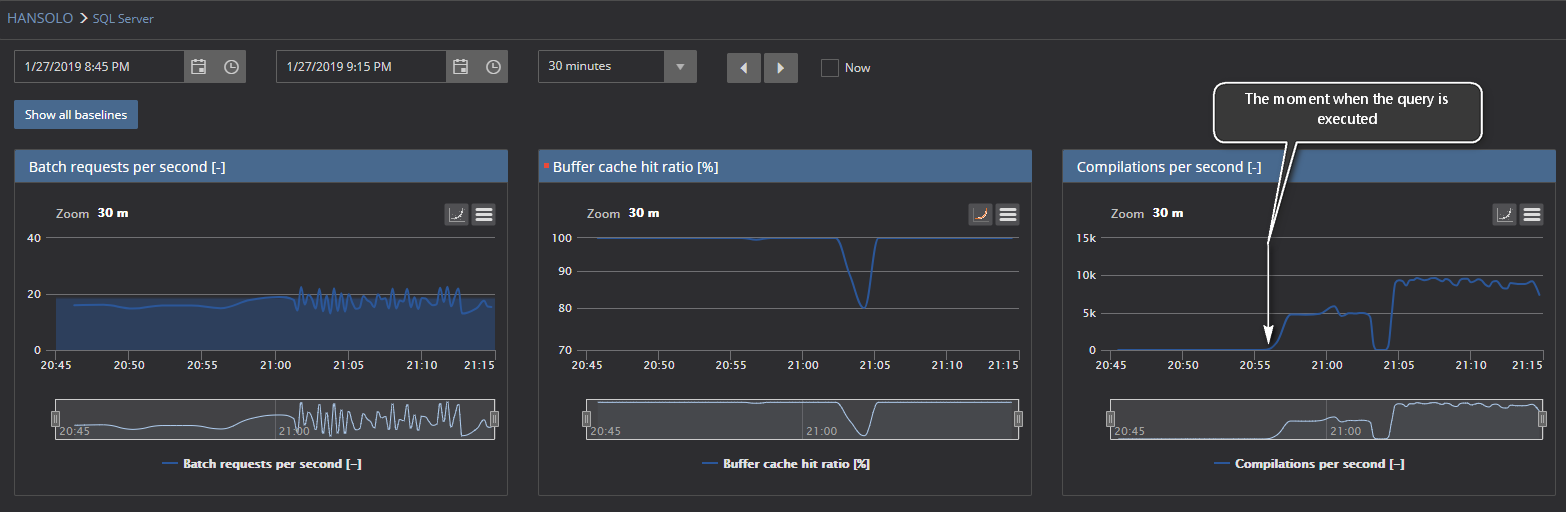
Here it can be seen the significant increase of Compilations per second metric values after a large number of ad-hoc queries have executed on monitored SQL Server
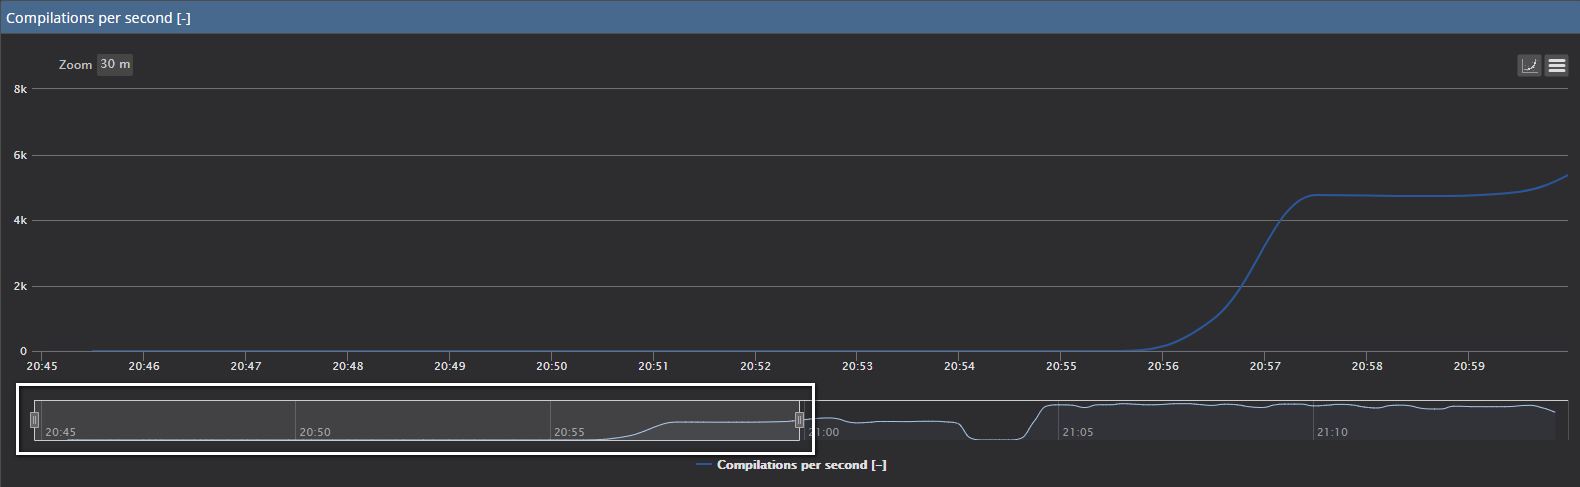
If we use the large chart view of Compilations per the second with the baseline turned on, and use the zoom functionality to isolate the period before and after the test query is executed:
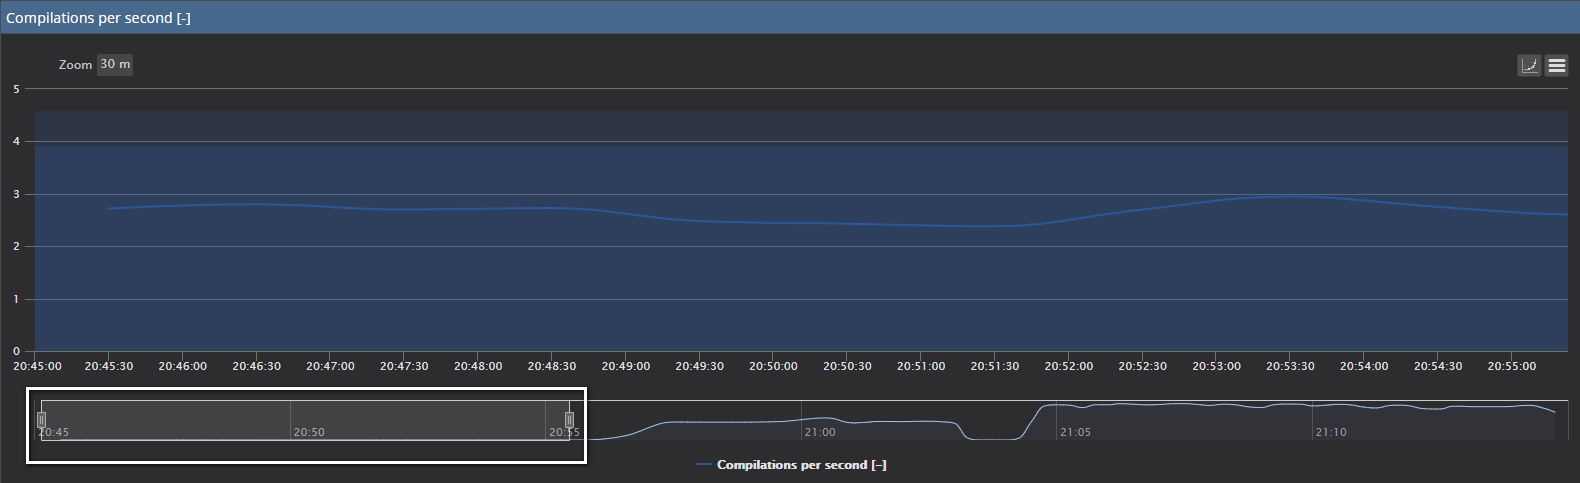
The zoom bar below the chart is with a focus to the period before the test query is executed and the standard Compilations per second values that are within the calculated baseline are displayed
Moreover, if we expand the zoom area on the right
-
Select the desired SQL Server in the server explorer pane on the left side or click on the SQL Server name in the main dashboard. That will open the instance dashboard