
Statistics Page
 View the Summary tab
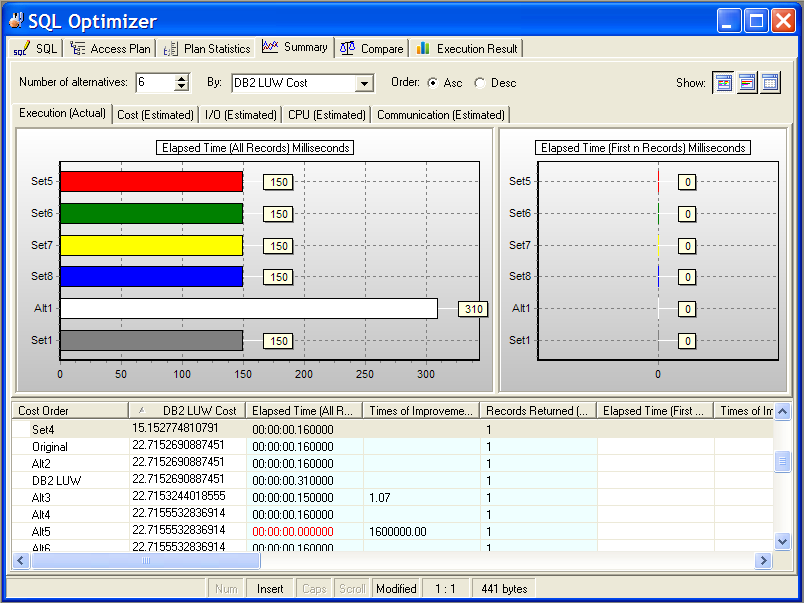
The Summary tab in the SQL Optimizer window displays the Run Time information and the cost estimates from various perspectives.
Run Time Pane
The Run Time pane displays the run time statistics for retrieving all records and for retrieving the first record.
Cost Estimates
Cost statistics shown on the Summary tab are estimated cumulative costs across all operations used in the access plan.
|
Item |
Description |
|
Buffers |
The estimated cumulative number of logical read requests for data pages that have gone through the buffer pool. This value is expressed in 4KB page units. |
|
Communication |
The estimated cumulative communication cost of executing the access plan up to and including the operation specified in the selected step. This value is expressed in TCP / IP frame units. |
|
CPU |
The estimated cumulative number of CPU instructions required to execute the access plan up to and including the operation specified in the selected step. |
|
First row |
The estimated cumulative cost of fetching the first row of data for the access plan up to and including the operation specified in the selected step. This statistic is expressed in timeron units. |
|
First row comm . |
The estimated cumulative communication cost of fetching the first row of data for the plan up to and including the operation specified in the selected step. This statistic is expressed in TCP / IP frame units. |
|
I/O |
The estimated total number of I/Os required for the access plan, up to and including the operation specified in the selected step. This value is expressed in units of 4KB pages. |
|
Next row CPU |
The estimated cumulative number of CPU instructions required to fetch the second row of data for the plan up to and including the operation specified in the selected step. |
|
Next row I/O |
The estimated cumulative number of I/Os required to fetch the second row of data for the plan up to and including the operation specified in the selected step. This statistic is expressed in timeron units. |
|
Next row total |
The estimated cumulative cost of fetching the second row of data up to and including the operation specified in the selected step. This statistic is expressed in timeron units. |
Charts
The statistics from the grid are grouped together and displayed in charts.
To select how many records are displayed in the charts
Select the number from the Number of Alternatives list.
To select which statistic to use to select the records
Select the statistic from the By list.
To select the top or the bottom range of the statistic
Select Asc (Ascending) or Desc (Descending) from the Order option.
Display or Hide Panes
Use the pane-control buttons to reorganize the panes:
To display the statistics and charts
Click Chart and Statistics .
To display only the charts
Click Chart Only.
To display only the statistics
Click Statistics Only .