Using Large File Support
Please see the Large File Support document, found by clicking the Help link on the Large File Upload page.
Large File Support and My Sites
If not already enabled, make sure the ID that is upgrading the farm has full control for the Web Application hosting the My Site Host. (Select the Web App, User Policy>Add user.) If enabling this access is not preferred, temporarily add the ID, then disable externalization on the StoragePoint profile, save it, enable externalization on the profile, save it, and remove the user from the Web App user policy when complete. Otherwise, my site users may see an error when they try to use the large file upload window on their my site.
Dashboard
Farm administrators can view information about the health and storage utilization of their Metalogix StoragePoint implementation.
Access and Navigation
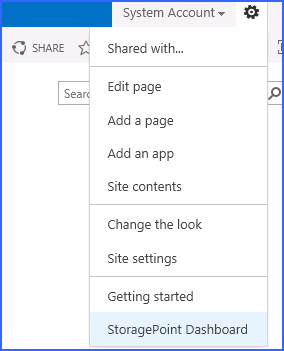
The Dashboard can be accessed from the StoragePoint Menu on the Application Management page. It can also be accessed from the site collection by the link found in the Site Actions menu.
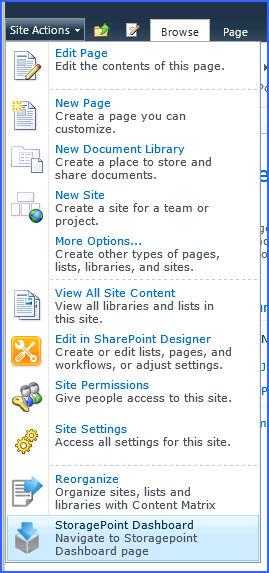
|
|
NOTE: Accessing the dashboard from a Site Collection will only provide Profile and Endpoint information for the profile covering the scope of that site collection. |

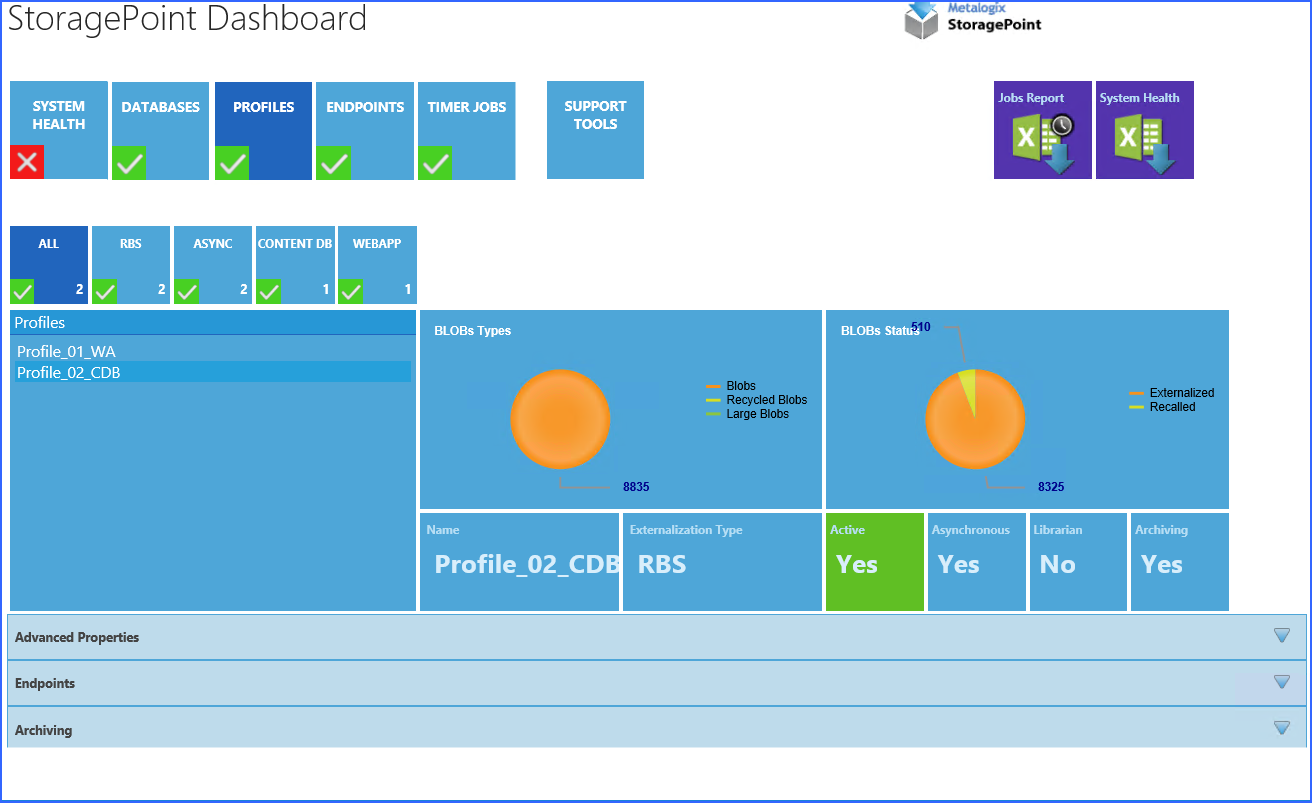
There are five main sections to the dashboard: System Health, Databases, Profiles, Endpoints and Timer Jobs. Support Tools is a BLOB ID decoder. Click the tile of each of these sections to see the relevant information displayed below.
The Jobs Report is covered below, and System Health Report works the same as the utility on General Settings.
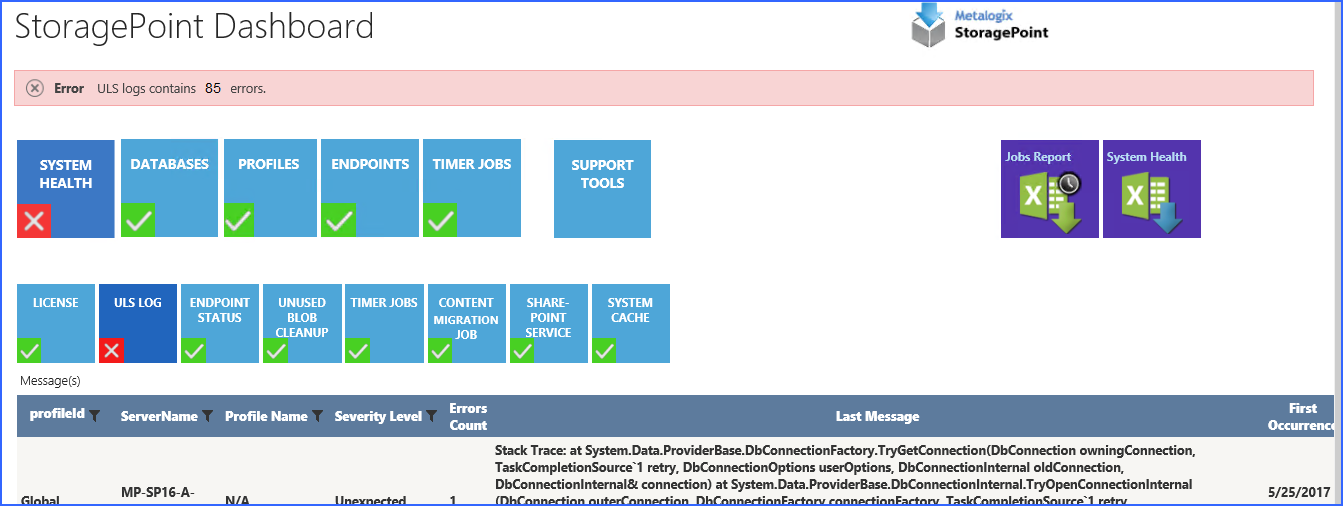
System Health will show the overall performance information, along with the status of some critical timer jobs. Each of the sub-tiles can be selected to display a status message along with a link to the page where more information can be found.
The ULS Logs link will indicate what errors are appearing in the ULS logs. These errors can be cleared from the dashboard using the Clear All links at the bottom of the page, but will remain in the logs.
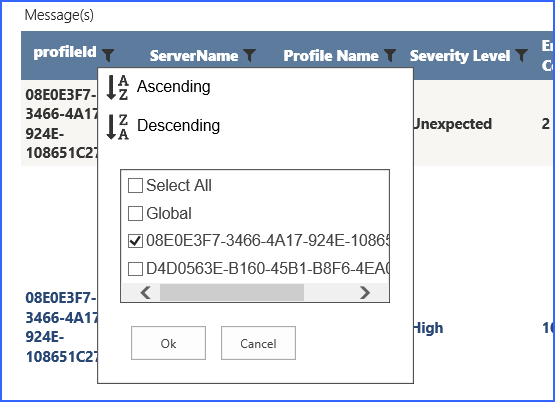
Use the filter buttons to organize the messages by Profile ID, Server Name, Profile Name or Severity Level.
The System Cache dashboard link will show whether the system cache is reaching a threshold, and advise steps to correct it, namely running the StoragePoint BLOB Health Analyzer for each profile, and the Content Migrator job.
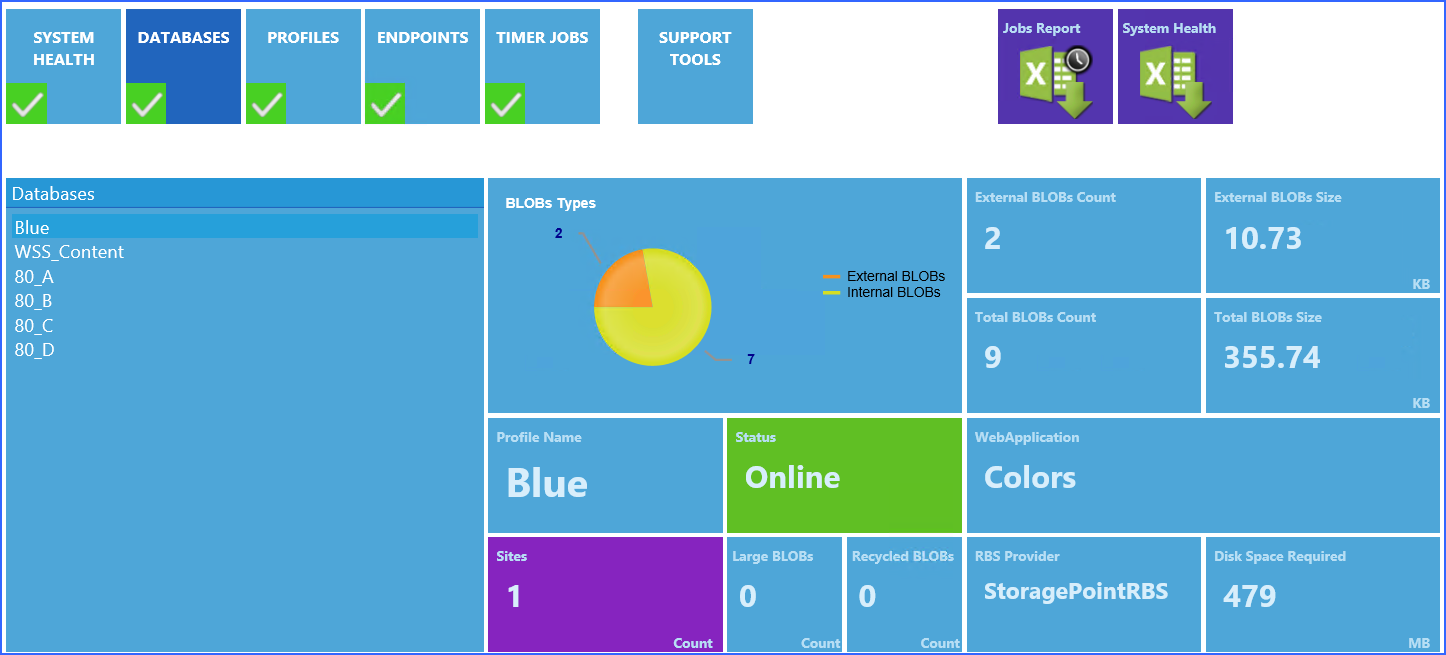
The Databases page shows all of the content databases in the SharePoint farm. Clicking the name of the database in the left column refreshes the data in the tiles to the right. If the tiles are not refreshing, security may have timed out: try refreshing the whole page.
Note that administrators can see the breakdown of internal and external BLOBs, and see in Disk Space Required, how much space is needed on an endpoint, at this point in time. Profile Name will say No Profile if the content database is not in a profile scope.
The Profiles page shows the configuration information for the StoragePoint profiles. The sub-tiles on this page can be used to filter the profiles if there are a large number of them configured for the farm. Select the name of the profile from the column on the left, and the graphs and fields will update accordingly. The expanding sections at the bottom also contain more information about the profile, such as which endpoints are storing BLOBs for the profile.
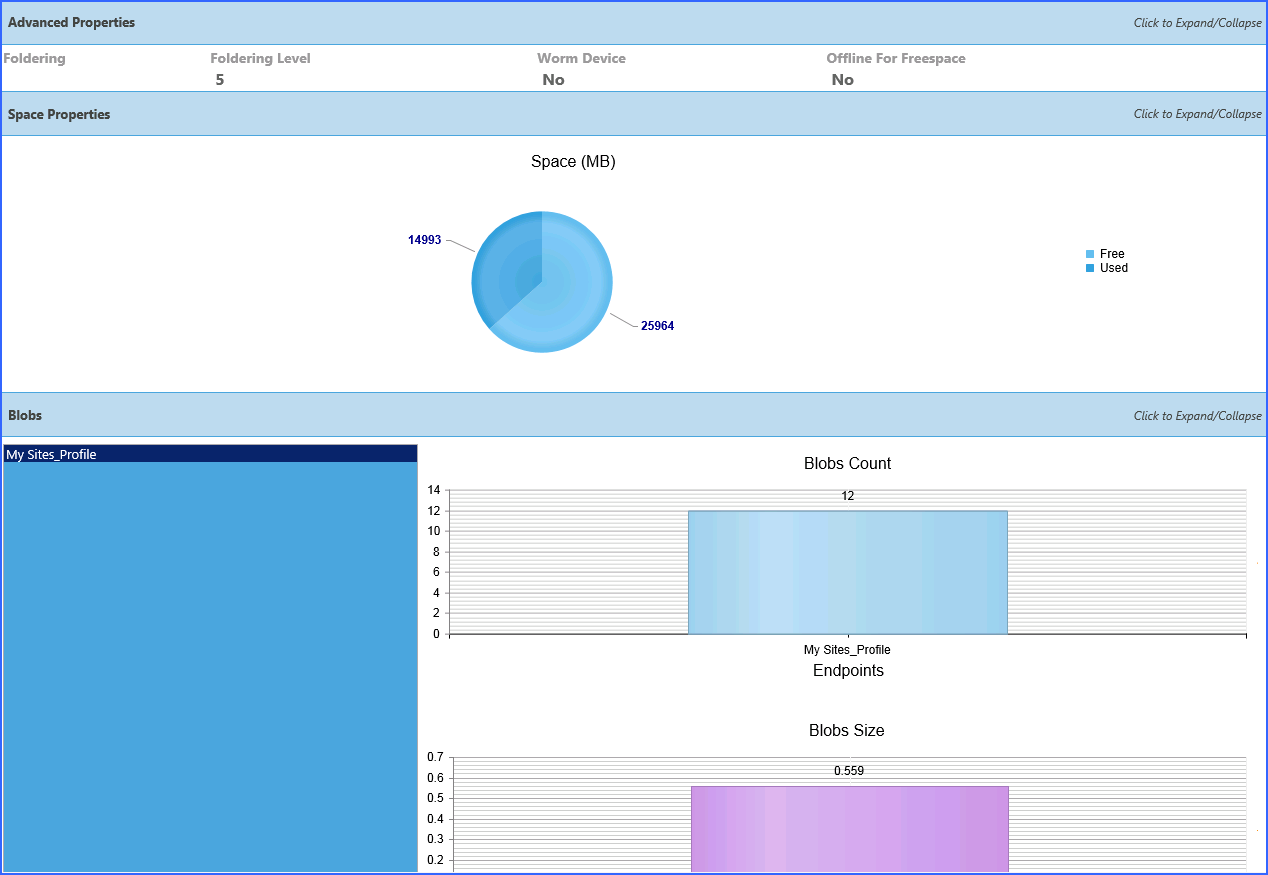
The Endpoints page opens with graphs that show information for all endpoints. Clicking the name of an endpoint will toggle the information between appearing or not, in the graph.
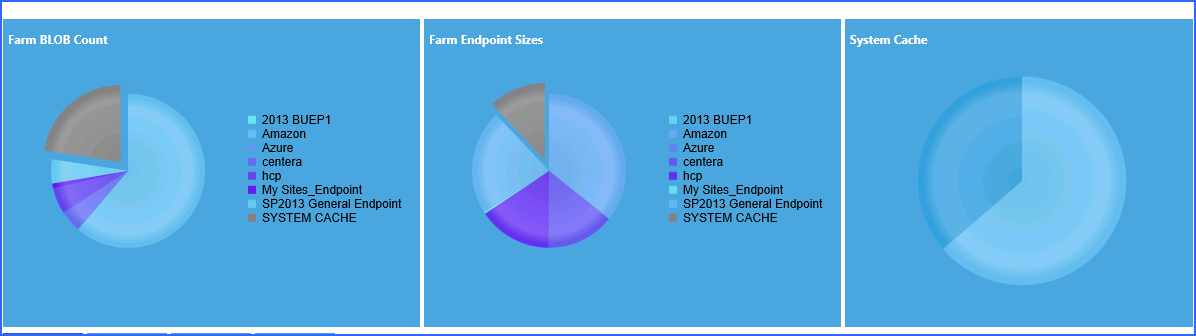
The sub-tiles can be used as filters if there are a large number of endpoints in the StoragePoint configuration.
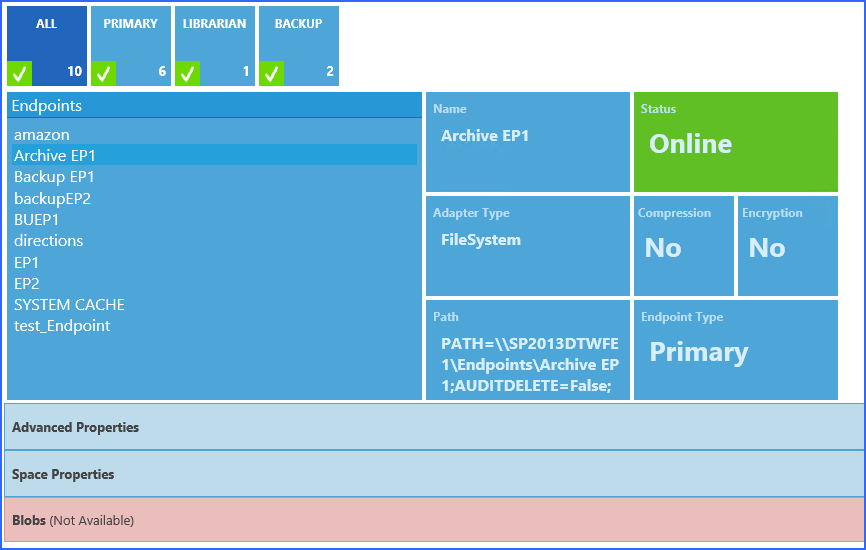
The expanding sections at the bottom contain more detailed information about each endpoint, included which profiles are using them. (If there is no information in the Space Properties, that endpoint cannot be monitored for free space.)
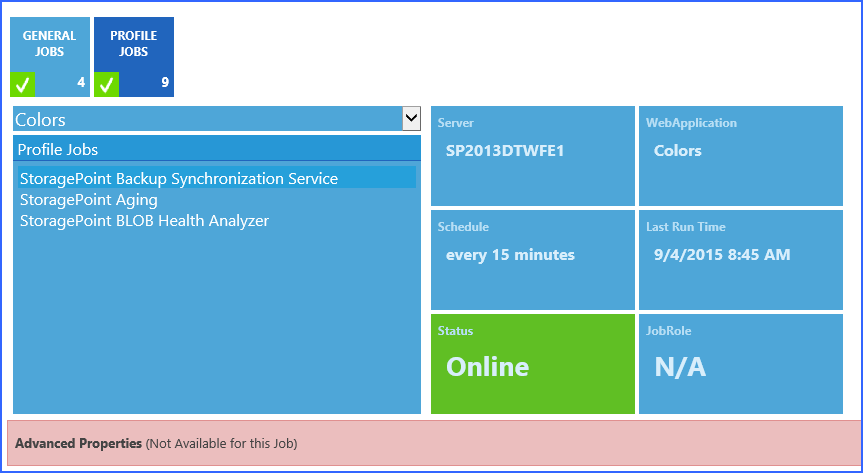
The Timer Jobs page shows the configuration options for both farm wide and profile specific timer jobs. Use the sub-tiles to select which to view. In the profile jobs page, select a profile to see which timer jobs are configured, and how, for that profile.