
Refreshing Topology
The Metalogix Diagnostic Manager Collection Service automatically refreshes its list of servers and other topology data within a SharePoint farm. By default, this data is collected every 24 hours. You can also force the Collection Service to refresh this data immediately if you choose.
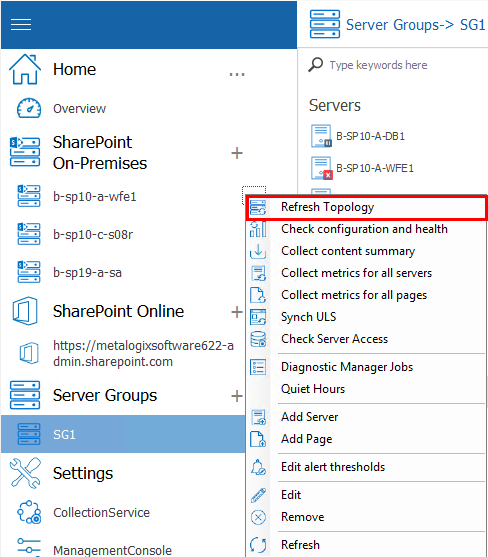
To refresh topology for a single SharePoint farm immediately:
1.In the Management Console tree, select a farm or its servers node for the farm whose topology you want to refresh,
2.Click the (...) next to the farm or server name, and select Refresh Topology from the drop down menu.
Collecting Metrics for All Servers or Pages Immediately
Normally, Metalogix Diagnostic Manager collects server metrics from the servers that make up your SharePoint farm or Server Group on a schedule you specify (see Setting the Collection Service Options). If necessary, you can also collect the metrics immediately.
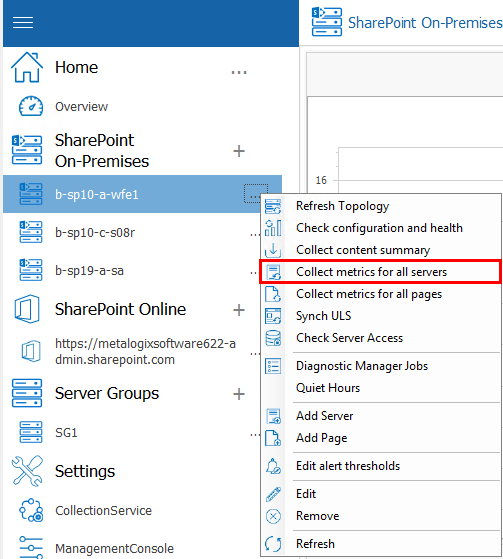
To collect server metrics in real time:
1.In the Management Console tree, select the farm or Server Group from which you want to collect metrics and click the (...) next to its name. Select Collect Metrics for all Farm (or Server Group) servers.
To collect monitored page metrics in real time:
1In the Management Console tree, select the farm or Server Group for which you want to collect page metrics, click the (...) next to it, and select Collect metrics for all farm (or Server Group) pages.

Viewing Server Detail
You can use Metalogix Diagnostic Manager to view the status of all servers or individuals servers, within a farm or Server Group, as well as customize the graphical view of server data.
Checking Server Access
If you are experiencing issues with data collection, you can check that the account(s) used for data collection have the appropriate access and permissions to all servers in the farm using the Check Server Access feature.
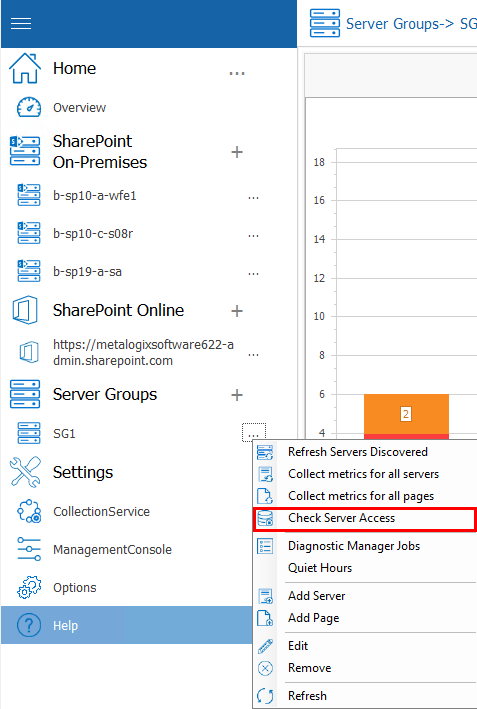
To check server access:
1In the Management Console tree, select the farm or Server Group whose server access you want to check.
2Select the (...) next to the farm or server group, and select Check Server Access from the drop down menu.
Metalogix Diagnostic Manager performs the following checks:
·For a farm Topology server, access to the Config database connection string
·For each server in the farm:
§WMI access to
§Windows Registry, and
§Windows Services
·access to the master database of each SQL Server instance.
If the account fails any of the server access and permissions checks, you can fix the issue on the affected server(s) then [Run Checks Again].