
Information in Exported Excel Files
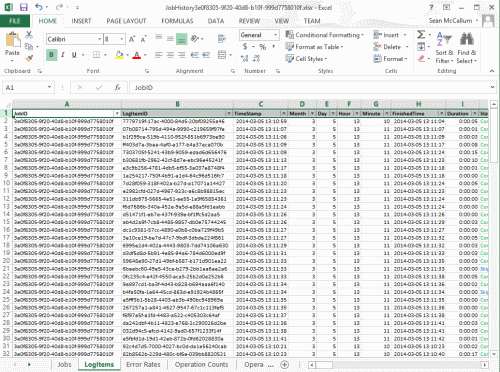
When an Excel file is exported from the Metalogix Content Matrix Job List there are a number of page tabs that can be viewed. Each page tab will display a different set of data, and some of these tabs will also display pivot graphs (with pivot tables behind them).
NOTE: The data within all of these Excel tabs (both the tables and the graphs) should only be considered a starting point when looking at your migration data. You can modify the existing graphs through various methods, such as applying filters, changing the data values, etc. You can also take the "raw" data from the LogItems tab and use it to create your own graphs or sets of data as required.
The exported file contains the following tabs:
·Jobs - All of the specific jobs that are included in the export. This includes migration jobs as well as other actions.
·LogItems - All of the operations that have been run by Metalogix Content Matrix and provide all of the logging details that are available in the Log Viewer and Log Item Details windows. Some examples of these operations are: adding lists, adding content types, copying documents, adding users, updating lists, etc.
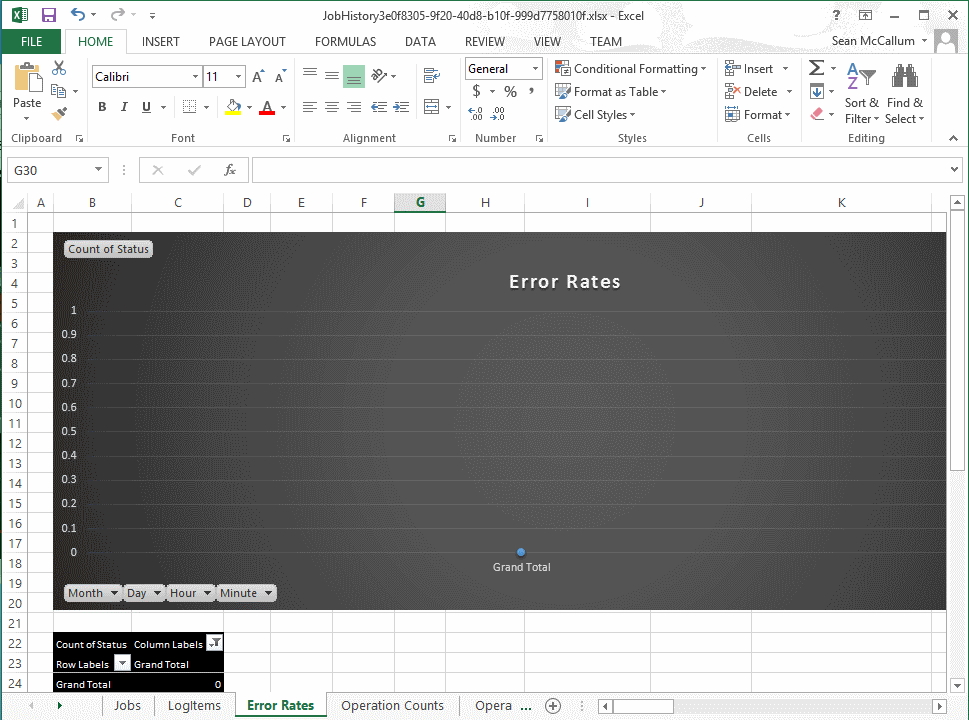
·Error Rates - A a graph that represents the number of errors and warnings that Metalogix Content Matrix encounters during a migration on a "per minute" basis. The vertical axis will list the number of errors/warnings that are encountered (at the specified time), and the horizontal axis lists the amount of time (displayed in a "per minute" value). The horizontal axis can also be changed to display in month, day, or hour time values as well. Below the graph is a table that provides a different view of the same error/warning breakdown.
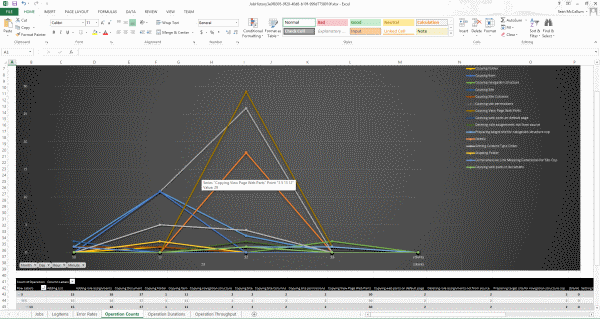
·Operation Counts - The number of operations/actions that are run over a period of time. Some examples are: copying sites, copying lists, copying documents, adding SharePoint groups, adding users, copying permissions, etc., and each operation has its own line representation on the graph. The vertical axis lists the number of operations that are running (at the specified time), and the horizontal axis lists the amount of time (this is displayed in a "per minute" value). The horizontal axis can also be changed to display in month, day, or hour time values as well. Below the graph there is a table that provides a different view of the same migration operation data.
·Operation Duration - The total duration of time for each operation/action type against the total migration time. This is potentially the most confusing graph to read in the exported Excel file. The vertical axis lists the total duration time for each action. This is determined by finding the difference between each operation/actions Time Started and Time Finished values, and then adding the totals together for all of that operation/actions of that type that are running. This is then displayed against the horizontal axis which lists the time (displayed in a "per minute" value) for the migration. The horizontal axis can also be changed to display in month, day, or hour time values as well. Below the graph there is a table that will provide a different view of the same migration data.
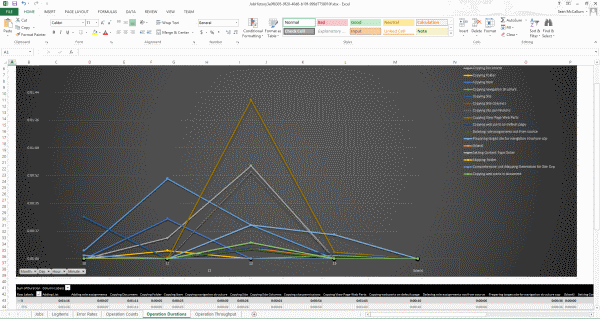
An example of how to read this graph is: if at minute 25 (of the hour, not the 25 minute of the migration) a large number of small documents are copied and completed (all in the 25th minute), then at minute 25 in the graph there will likely be a spike in the "duration time" for the "Copying Document" operation/action. If each document was copied in 2 seconds, and there were 41 small documents, then the Sum of Duration value would be listed as 82 seconds (or 0:01:22). So the results in the graph would show a spike for the Copying Document operation/action and minute 25, with a value of 0:01:22.
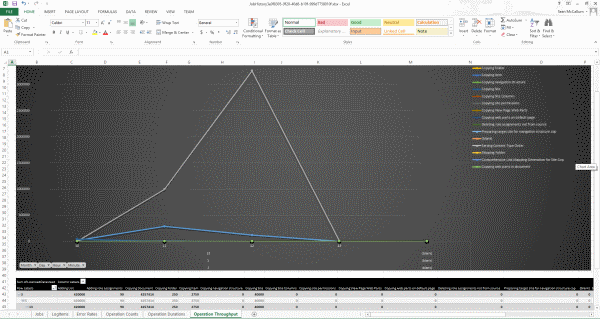
·Operation Throughput The amount of data/throughput (in MB) that is migrated on a "per minute" basis. The vertical axis lists the amount of data that is being pushed through Metalogix Content Matrix for a given operation (at the specified time), and the horizontal axis lists the time (displayed in a "per minute" value) at which that the action was performed. The horizontal axis can also be changed to display in month, day, or hour time values. Below the graph there is a table that will provide a different view of the same throughput data.
Copying Job Logging to Other Applications
It is possible to copy the results of migration jobs from log files to other applications. This can be beneficial if you want to keep track of copy or incremental information outside of Metalogix Content Matrix, or want to manipulate the information for reporting or retention purposes. The log information is copied as text, to the clipboard, and can then be pasted within any other application that allows text pasting. For example, if a copy action was made, the logging can be copied into a Word file, or into an Excel spreadsheet, then saved.
NOTE: Only the end results of the total action will be copied.
To copy the logging for a job list:
1.Select a job from the Job List.
2.Right-click, and choose Copy selected job to clipboard (alternately Ctrl+C can be used).
3.Open the desired target program (for example: Microsoft Word, Microsoft Excel, Notepad, etc), then paste the content into the application (Ctrl+V, or the paste command in the application itself).
NOTE: The logging for each action within the list must be copied separately.
To copy the logging for job items:
·Select the desired job list or job item(s) that the logging is to be copied from, and open the job list to access the Log Viewer.
·Select any job items that are to be copied. Single or multiple items can be selected in the Log Viewer. In order to copy the logging for the entire job, all job items in the Log Viewer must be selected.
·When all of the desired items are selected, right-click on one of them, and select Copy Log Items to Clipboard, and select to either copy them with, or without details. The Details are a set of extra columns that are added to the logging. These columns are typically: Details, SourceContent, and TargetContent. These columns do not always contain extra information. The default copy option (Ctrl+C) is to copy the logging without the Details.
Creating a Support Zip File for a Migration Job
You can generate a zip file of data associated with a single job item to help Quest Support facilitate troubleshooting.
The high-level data collected in the zip file includes:
·Application Settings files.
·Product information (product version, license, etc.).
·Information about the job item (what action settings were set, the job log, etc.).
IMPORTANT: Please review the contents of the zip file before sending it to Support. While this feature attempts to only collect non-sensitive data, no guarantees can be made - it is up to you to ensure that any files in the zip folder are stripped of any confidential data. Regardless, Quest assures that the contents of the zip file will only be used for troubleshooting the associated support ticket.
To create a support zip file:
1.In the Job List, select the job for which the zip file is to be generated.
2.Use one of the following options:
§In the main ribbon, click the Help tab, then Create Support Zip File.
§Right-click and choose Create Support Zip File.
3.Save the file to the desired location using the desired file name.
4.If you wish to review the zip file for sensitive information, click Yes to open the zip file. Once you are satisfied with the contents of the zip file, it can be sent to Quest Support to aid in troubleshooting.
Enabling Trace Logging
You can enable trace logging on the machine where Content Matrix is installed and migrations are run to assist Quest Support with troubleshooting.
NOTE: For Distributed Migration, trace logging must be enabled on each agent machine.
To enable trace logging:
1.Open the file LogSettings.xml, which can be found in one of the following folders:
·If you are required to be a local administrator on the machine where Content Matrix is installed: C:\ProgramData\Metalogix
OR
·If you are not required to be a local administrator on the machine where Content Matrix is installed: C:\Users\<username>\AppData\Roaming\Metalogix\Common
2.Set <LoggingLevel> to one of the values described in the following table.
WARNING: When trace logging is enabled, entries are appended to the log file for each migration job that is run, and the same log file is used for all editions. This means the log file can become very large, which is why it is recommended that you only enable trace logging at the request of Quest Support.
|
Value |
Description |
|---|---|
|
None [Default] |
Trace logging is disabled (i.e., no entries are written to the log file). |
|
Error |
Only Error messages are logged. |
|
Debug |
Error and Debug messages are logged. NOTE: Debug should only be used for advanced troubleshooting as it may impact migration performance. |
Log entries are written to the file MetalogixGlobalLog.txt, which is located in the same folder as LogSettings.xml.