
Settings
Log files that are generated by the application have different levels of severity. The Settings page lets you specify the logging level of system messages.
Steps to set the logging level
1.From the navigation panel on the left, click CONFIGURATION and then click SETTINGS. The Settings page opens.
2.From the Logging Level drop down, select one of the following log levels listed below by descending severity:
·Verbose - Logs that contain the most detailed messages. These messages may contain sensitive application data. These messages are deactivated by default and should never be activated in a production environment.
·Debug - Logs that are used for interactive investigation during development. These logs should primarily contain information useful for debugging and have no long-term value.
·Information - Logs that track the general flow of the application. These logs should have long-term value.
·Warning - Logs that highlight an abnormal or unexpected event in the application flow, but do not otherwise cause the application processes to stop.
·Error - Logs that highlight when the application processes stop due to a failure. These should indicate a failure in the current activity, not an application-wide failure.
·Fatal - Logs that describe an unrecoverable application or system crash, or a catastrophic failure that requires immediate attention.
|
|
NOTE: The level you choose will also include all levels below it. For example, if you choose Verbose, all the other log levels will also be tracked. If you choose Warning, then the only the log levels Warning, Error and Fatal will be tracked. |

Support Tools
Support Tools are provided with the installation media.
To access the support tools:
1.Download the installation ZIP file and extract all the files on the machine on which you are planning to install the SCM components.
2.Open the Support Tools folder.
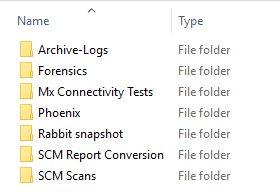
A summary of each tool is provided below. Each folder contains a ReadMe.txt file that provides detailed information about the tool.
Archive-Logs
A PowerShell script to create a copy of all the log files for SCM into a single .zip file.
Forensics
PowerShell scripts to visualize the time line of verbose SCM log entries for better troubleshooting.
Mx Connectivity Tests
PowerShell script and aspx page to troubleshoot the connectivity to SQL server.
Phoenix
Command-line program that helps you to process RabbitMQ dead-letter messages. Helps you to capture content to SQL, resubmit, or move messages to a new Queue.
Rabbit Snapshot
PowerShell script to import and export a RabbitMQ configuration from one machine to another.
SCM Report Conversion
PowerShell script to convert the exported scan report to an Essentials format for integration. In SCM 2.1.1 and later versions, report conversion is possible directly from the Administration Center.
SCM Scans
PowerShell scripts to submit a file share scan and download the resulting CSV report. The script requires a Profile Id. To get the Profile Id of a standard or custom profile:
1.From the navigation panel in the Administration Center, click CONFIGURATION and then click PROFILES. The Profiles page opens.
2.Click a profile link. The Profile - Summary page opens.
3.Get the Profile Id from the URL. For example, for the Personally Identifiable Information (PII) profile, the Profile Id is 1 (https://<domain:port>/#/profile/view/1)
Appendix
Steps to get the URL for the SCM Administration Center
1.Log in to the SCM Server and open the Command console.
2.Run the command ipconfig /all
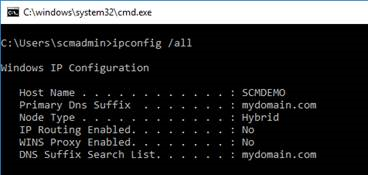
3.Get the FQDN of the server from the windows command prompt. This gives you [Hostname].[Primary Dns Suffix]. For example, SCMDEMO.mydomain.com
4.Open IIS Manager to get the protocol and port.
a.Expand the server node.
b.Expand the Sites node and select SCMAdminPortal
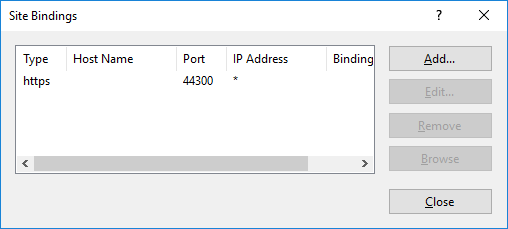
c.From the Actions pane click Bindings. This will give you [protocol] and [port]. For example, the protocol is https and the port binding is 44300.
Gather all this information together to construct the URL [protocol]:// [Hostname].[Primary Dns Suffix]:[Port]. For example, https://SCMDEMO.mydomain.com:44300