
Metalogix Sensitive Content Manager
Metalogix Sensitive Content Manager (SCM) provides a reliable, accurate and flexible solution for detecting sensitive information such as Personally Identifiable Information (PII), Protected Health Information (PHI) and Payment Card Industry (PCI) in English, German, Spanish, Italian, French and Portuguese, within enterprise content management systems.
This guide contains instructions for the administration of Sensitive Content Manager.
Integration with Metalogix ControlPoint and Microsoft SharePoint
SCM can leverage the existing security, compliance and administration capabilities of Metalogix ControlPoint to enforce policies using the full range of Microsoft SharePoint's permissions management, auditing and user activity reporting. With on-demand scanning, administrators can flag specific libraries, sites, or site collections for content discovery, or use real-time content shield by analyzing files as they are created, modified, moved, or destroyed. The combination of SCM and Metalogix ControlPoint offers a powerful Data Loss Prevention (DLP) solution that uses customizable and intelligent scanning subsystems to identify, track, and secure documents. This ensures a more robust level of information governance inside increasingly complex enterprise environments.
Integration with Metalogix Essentials
Essentials and SCM together allow a customer to selectively migrate file-share content based on the sensitive nature of the content after analysis with SCM.
SCM Architecture
Metalogix SCM uses a microservices architecture that is comprised of several services that can be deployed on a single server or distributed across several servers. These services work together to analyze documents using regular expressions and machine learning. The SCM components are described below:
SCM Databases
Each service has its own database which together form the SCM Databases and represent the central repository for the configuration, analysis results and operational metrics of the Metalogix SCM.
Service Bus
Metalogix SCM uses RabbitMQ as the service bus. It provides the intelligent message routing, event queuing and sequencing needed by SCM to analyze the files.
SCM Services (IIS)
·Admin Portal - The SCMAdminPortal service manages the SCM Administration Center.
·Admin Services - These are back-end services that feed information about other services to the SCM Administration Center.
oSCMAdminService is used for license management, monitoring the system health and other administrative operations of SCM.
oSCMAdminService-Analytics
oSCMAdminService-Notifications
oSCMAdminService-Profiles
oSCMAdminService-Scans
oSCMAdminService-Subquestions
·File Upload Service - When integrated with Metalogix ControlPoint, the SCMFileUploadService receives the requests to analyze one or more files. It stores these files and submits a request to the queue to analyze these files.
·Profile Service - A profile is a named collection of content search and analysis guidelines. Each profile is made up of sub-questions, weights and file thresholds. The SCMProfileService serves the profiles that are needed for content analysis.
·Result Service - When integrated with Metalogix ControlPoint, a REST API call requests the SCMResultsService to return the metrics and results of the files that were analyzed by the Analysis Service. Results are kept for a limited period.
·Subquestion Service - A sub-question is a search term used to identify a specific kind of sensitive content. The SCMSubquestionService serves the entire collection of sub-questions available for use within profiles.
·Scan Service - The process of analyzing files in a file-share and the generated report is called a scan. The SCMScanService allows you to submit, cancel or delete scans, and serves metadata about running scans and scan reports.
·Analytics Service - The SCMAnalyticsService collects and stores data about analysis throughput. Collected data supports the dashboard experience and is only kept for a limited period.
·Notification Service - The SCMNotificationService provides live-updates for scan progress, health and notifications within the SCM Administration Center.
SCM Services (Windows)
·Document Routing Service - When files are uploaded for analysis, they are stored in a specific temporary folder on the SCM Server. The Metalogix SCM Document Routing Service inspects each file from the folder to check whether these files are single files or complex files like compressed files or emails with attachments. Since only single files can be analyzed, this service submits complex files to the Archive Extraction Service to extract individual files for analysis. You can analyze the following file types: Compressed files, Microsoft Office Files, Open Document Text, Portable Document Format, Rich Text Format, and Text Document.
·Archive Extraction Service - When complex files are submitted for analysis, the Metalogix SCM Extraction Service extracts individual files from the file set.
·Document Processing Service - When single files are ready for analysis the Metalogix SCM Document Processing Service extracts the content from the files.
·Analysis Service - The Metalogix SCM Analysis Service analyzes the content in each file using regular expressions and machine learning technology. Sensitive files are permanently deleted from the temporary folder when the analysis is completed.
·Crawler Service - The Metalogix SCM Crawler Service inspects the contents of a file-share and the sub-folder hierarchy for supported files that are submitted for analysis.
SCM Administration Center
The SCM Administration Center provides an overview of the scan results and lets administrators manage licenses, monitor the system health, and work with system logs to analyze the health of services with greater granularity.
|
|
NOTE: The installed version is indicated at the bottom of the navigation panel. |

Steps to open the SCM Administration Center
1.Log in to the SCM Server.
2.Double-click the desktop shortcut to open the SCM Administration Center. You can also enter the URL directly in a browser. To get the URL for your own installation see Steps to get the URL for the SCM Administration Center.
3.In the Sign in dialog that opens, enter the credentials of the SCM Administrator.
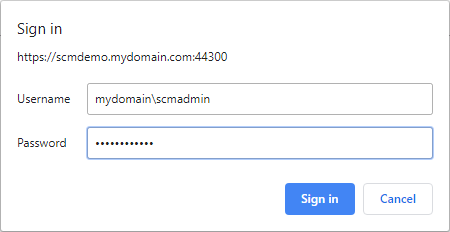
4.Click Sign In. The License Information page opens by default.
5.You can navigate to any administration feature accessible with your license.
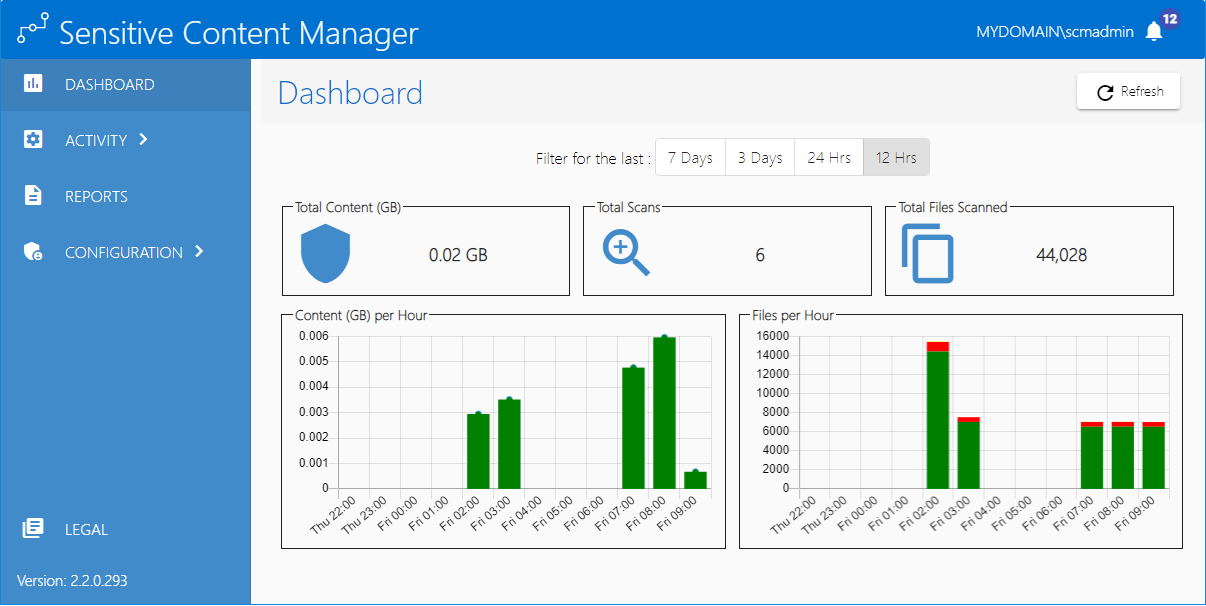
Dashboard
The Dashboard is the default page that opens when you log in to the SCM Administration Center. It provides a snapshot of the scan results over a pre-selected period and helps you to inspect the scans in greater detail.
Refreshing the dashboard data
Since the Dashboard presents a snapshot of the scans, you must click Refresh to update the snapshot to view the performance of any scans that are in progress.
Dashboard filters
The Dashboard provides four preset filters to present data about past and present scans. Click any preset filter to get the data for that period.
7 Days - presents scan data from the scans that started within the last seven days. This is the default selection.
3 Days - presents scan data from the scans that started within the last three days.
24 Hrs - presents scan data from the scans that started within the last 24 hours.
12Hrs - presents scan data from the scans that started within the last 12 hours.
|
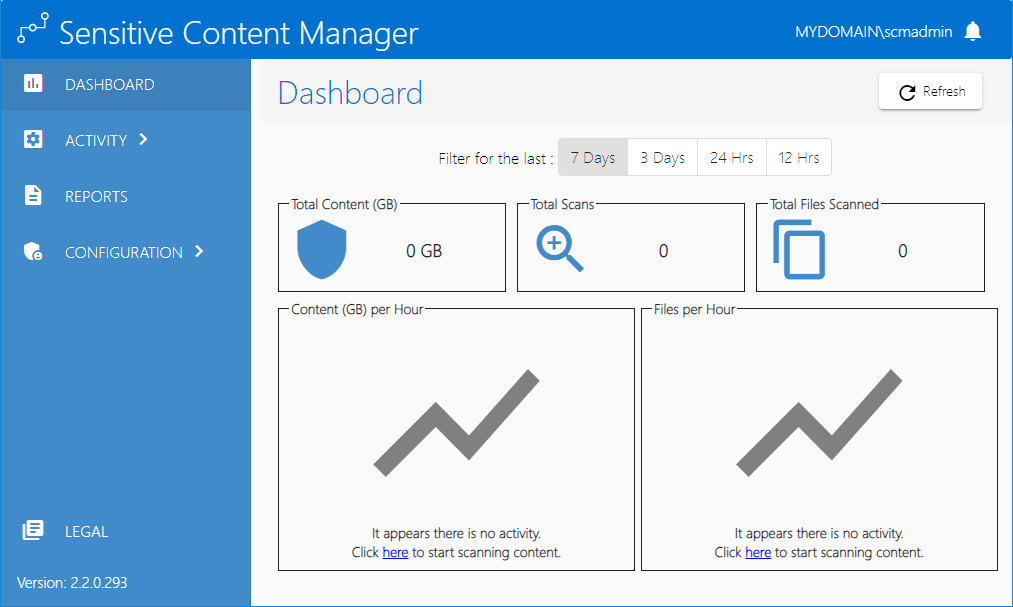
|
NOTE: If there are no scans that are in progress or completed within the period filter that you select, you will see empty panels in the Dashboard. Click the hyperlink in the line Click here to start scanning content to submit a scan report and start a scan. |
Dashboard panels
There are five panels on the Dashboard as described below:
Total Content (GB)
This panel displays the latest snapshot of the total size of data (in GB) processed within the period selected from the filter.
Total Scans
This panel displays the latest snapshot of the number of scans that started within the period selected from the filter. When the snapshot is taken, the scans could be in one of the following states: In Progress, Canceling, Canceled, or Completed.
Total Files Scanned
This panel displays the latest snapshot of the total number of scanned files within the period selected from the filter.
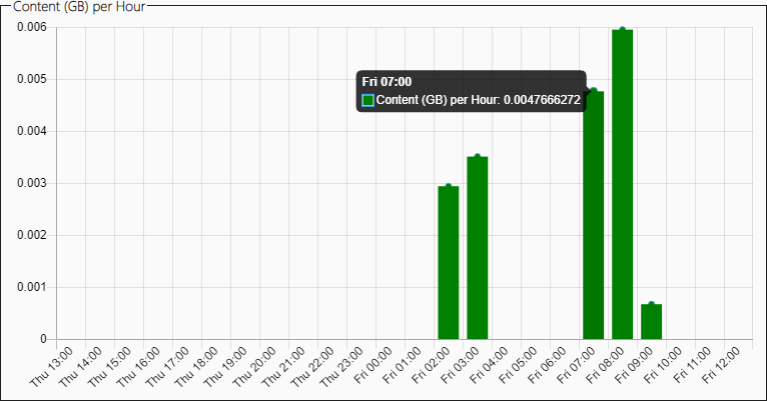
Content (GB) per Hour
This chart displays the latest snapshot of the total size of the data (in GB) processed per hour within the period selected from the filter. A line chart is displayed if the period filter is either 7 Days or 3 Days. A bar chart is displayed if the period filter selected is either 24 Hrs or 12 Hrs. When you hover your mouse over a line or bar, the Content (GB) per hour parameter is displayed.
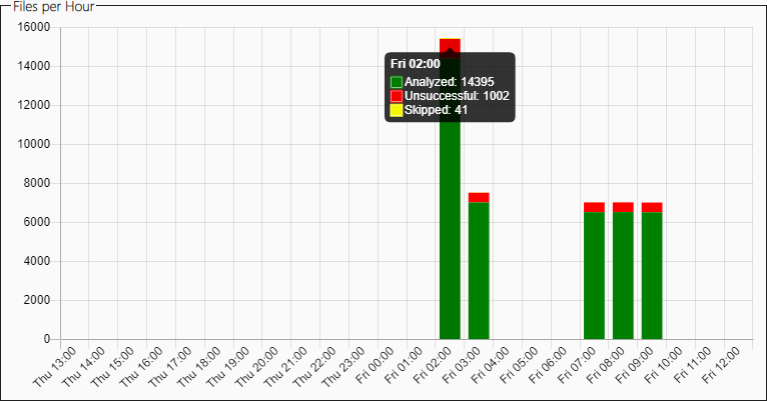
Files per Hour
This chart displays the latest snapshot of the total number of files processed per hour within the period selected from the filter. A line chart is displayed if the period filter is either 7 Days or 3 Days. A stacked bar chart is displayed if the period filter is either 24 Hrs or 12 Hrs.
The line or bar chart has three data points. When you hover your mouse over a line or bar, the following data points are displayed:
a.Analyzed - indicates the number of files that were successfully analyzed.
b.Unsuccessful - indicates the number of files that could not be analyzed.
c.Skipped - the number of files that could not be submitted and were not processed any further. There could be several reasons why files are skipped. For example, files may be skipped because the file type is not supported, there is a problem reading the contents of the file, there is low disk space on the server, or the file upload service was unavailable.
Content Processed by Service
To access this chart, click the Content (GB) per Hour chart in the Dashboard.
This chart displays the latest snapshot of the total size of the data (in GB) processed by each service per hour within the period selected from the filter. A line chart is displayed if the period filter is either 7 Days or 3 Days. A grouped bar chart is displayed if the period filter is either 24 Hrs or 12 Hrs.
If you have a distributed deployment, an additional filter is available that lets you select the server node to inspect the performance of services installed on that node.
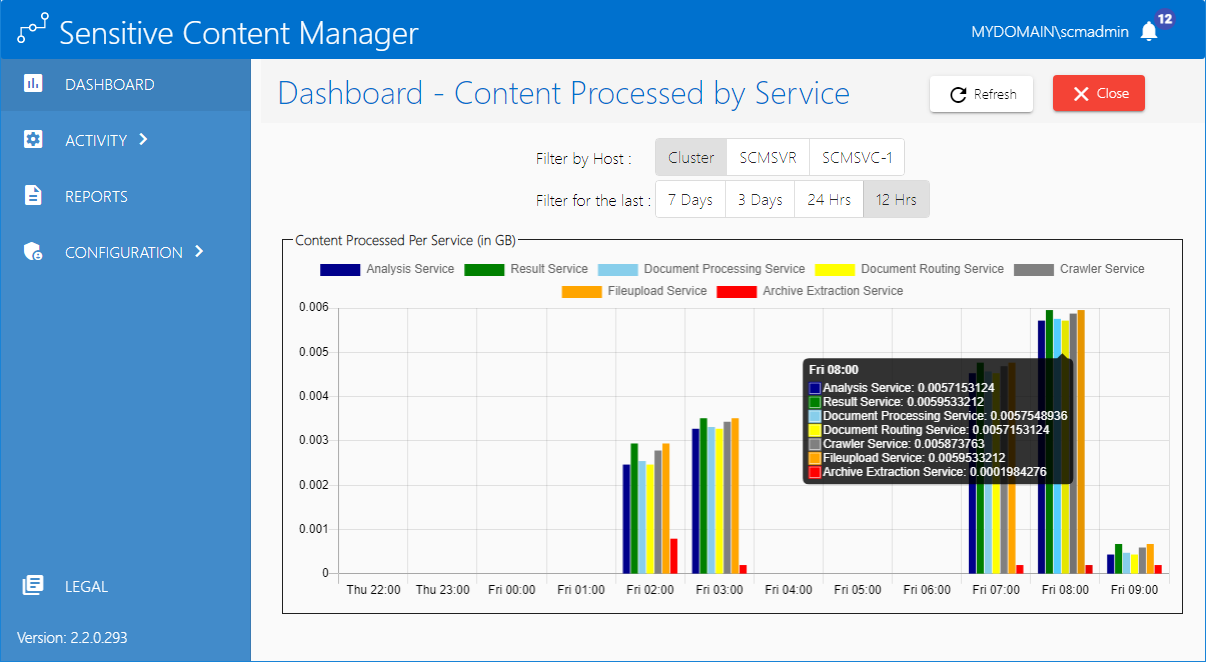
Chart operations:
1.Hover your mouse over a line or bar to view the number of files processed by each service. You can inspect the performance for all the services or you can choose specific services that you want to inspect.
2.Click any service or its color code that you want to exclude from the chart. The service name that is excluded will be indicated with a strikethrough.

3.Click the service (or its color code) that was previously excluded and you want to include in the chart. The strikethrough disappears from service names that are included in the chart.
4.Click Refresh to get a fresh snapshot of the chart data.
5.Click Close to return to the Dashboard.
Files Processed by Service
To access this chart, click the Files per Hour chart in the Dashboard.
This is a detailed chart that displays the latest snapshot of the total number of files processed by each service per hour within the period selected from the filter. A line chart is displayed if the period filter is either 7 Days or 3 Days. A grouped bar chart is displayed if the period filter is either 24 Hrs or 12 Hrs.
If you have a distributed deployment, the Filter by Host is an additional filter that is available that lets you select the server node to inspect the performance of the services installed on that node. The default is Cluster which includes services from the primary SCM server as well as the server nodes.
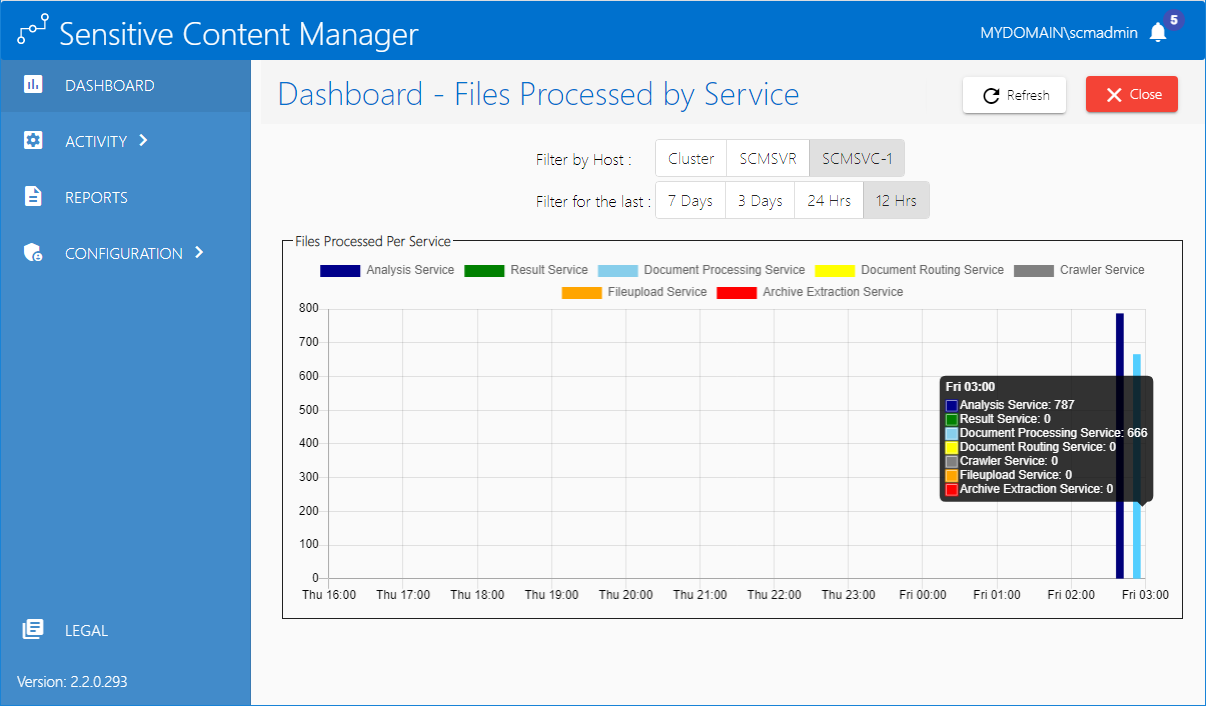
Chart operations:
1.Hover your mouse over a line or bar to view the number of files processed by each service. You can inspect the performance for all the services or you can choose specific services that you want to inspect.
2.Click any service (or its color code) that you want to exclude from the chart. The service name that is excluded will be indicated with a strikethrough.
3.Click the service (or its color code) that was previously excluded that you want to include in the chart. The strikethrough disappears from service names that are included in the chart.
4.Click Refresh to get a fresh snapshot of the chart data.
5.Click Close to return to the Dashboard.
Notifications
Notifications are messages about the progress of scan reports.
To view the notifications click the notification icon at the top right corner of the SCM Administration Center. The notification icon all indicates the number of messages in the notification panel.
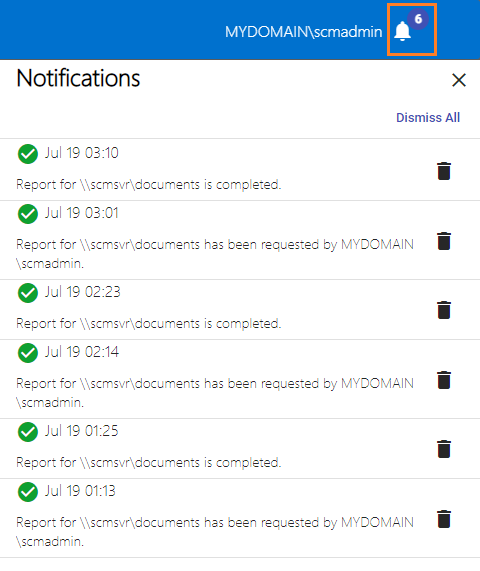
The Notifications panel displays the date and time the message was posted and the message. The You can perform the following actions in the Notifications panel:
1.Click X to close the panel.
2.Click Dismiss All to clear all the messages from the panel.
3.Click 
License Management
The License Information page of the SCM Administration Center lets you to register your product and view your license details. When you download and install a trial version of Metalogix SCM you get a free 30-day trial license. If you would like to purchase a license, contact Quest to get your license key and follow the instructions presented here.
|
|
NOTE: You must reactivate your license after an upgrade to ensure new license-linked features are synchronized with your license. |
In this topic
·Steps to view the license information
·Steps to activate your license online
·Steps to activate your license offline
Steps to view the license information
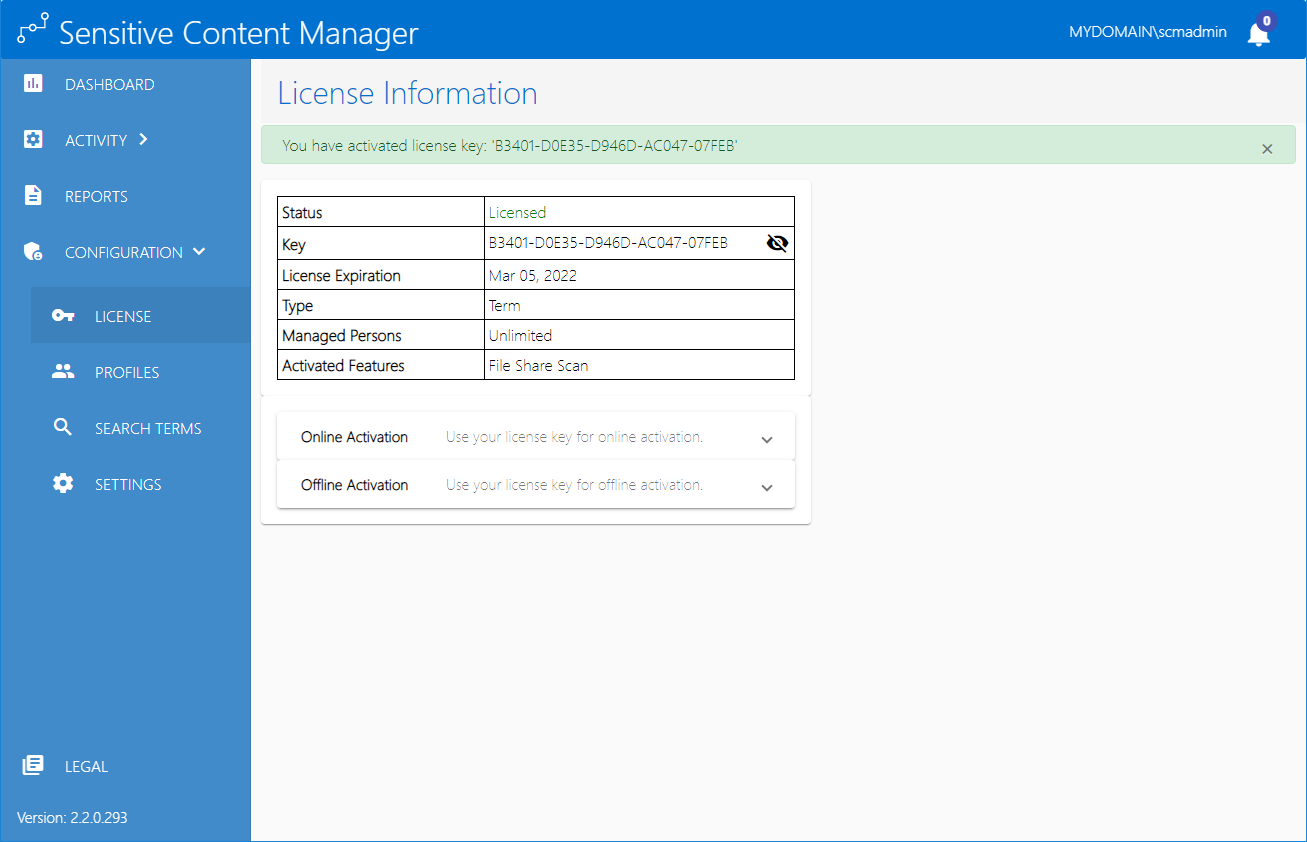
1.From the navigation panel click LICENSE. The License Information page opens.

The information about the license that is displayed on this page is described below:
Status - the current state of your license. Valid values are Licensed and Unlicensed.
Key - The encrypted license key that controls the features activated in SCM. Click the eye icon to view the password.
License Expiration - Date when the license will expire.
Type - Nature of the license. A Term license indicates that a specific end date is present.
Managed Persons - number of licensed users.
Enabled Features - Indicates that the File Share Scan feature has been activated through the license. When this feature is activated, the Reports section in the navigation panel will be displayed. For more information see Reports.
|
|
NOTE: When you upgrade your version, you must reactivate your license key to activate the new features. For example, when the File Share Scan feature is activated, the License Information panel displays additional information like Managed Persons and Enabled Features. In addition to these, the Reports section in the navigation panel will be displayed. For more information see Reports. |
2.If the license has expired, the License Information page will indicate the details of the expired license.

3.Contact your Quest sales representative to renew your license.
·When you register and download a trial version of the Metalogix SCM, the trial license key is specified in the email that is sent to you.
·When you activate the trial license, the License Information page opens.
·The Type field indicates Trial.
·It is valid for 30 days (date of license issue + 29 days) and you can try all the features that are available.
·The Analysis service and the File Upload service will stop functioning after 30 days.
Steps to activate your license
1.Log in to the SCM Administration Center and click License from the navigation panel. The License Information page opens.
2.Enter you license key in the License Key field.
3.Click Next. The Activate using provided license key step is activated.
4.Click Activate Online. If the License Key is valid, The Activation Complete step is activated.
5.Click Finish. Refresh the page to update the license status and access the licensed features.
Steps to activate your license offline
This option lets you access the Quest offline activation web site when you have a working internet connection.
1.Log in to the SCM Administration Center and click License from the navigation panel. The License Information page opens.
2.Expand the Offline Activation section.
3.Step 1: Enter your license key
a.In the License Key field, enter your license key and click Next.
4.Step 2: Get Activation Data
a.Click Get Activation Data.
b.When the data is available, the next step is activated
5.Step 3: Copy/Save activation data
a.Select from the two options described below:
Option 1: Click Save Activation Data to Clipboard. The activation data is saved to memory. Use this option if you plan to follow through with the subsequent steps immediately.
Option 2: Click Save Activation Data to File. The Windows File dialog opens. Use this option if you plan to activate the license later. Specify a file name for the activation data file and click Save to save the file to a location of your choice.
6.Step 4: Submit Activation Data
a.Using your alternate internet connection navigate to https://support.quest.com/offline-activation.
b.In the previous step, if you opted to click Save Activation Data to Clipboard, place your cursor in the Activation text field and click Ctrl-V to paste the activation data.
c.In the previous step, if you opted to click Save Activation Data to File, click Choose File and locate the saved activation data file.
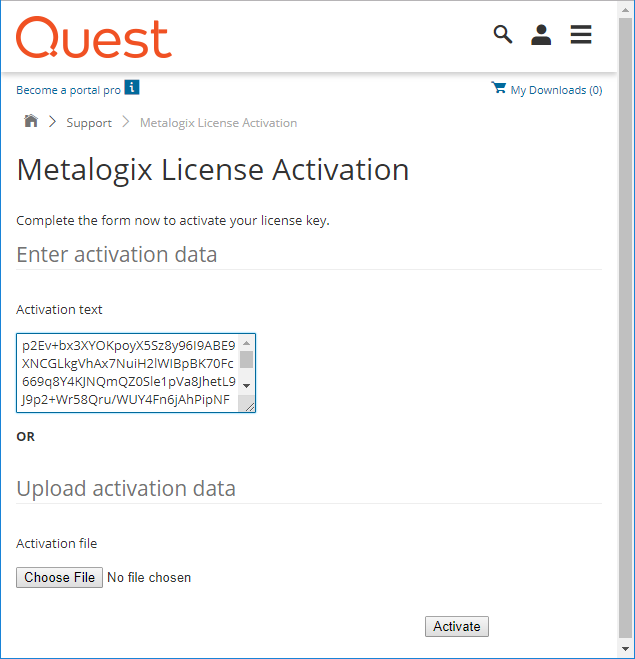
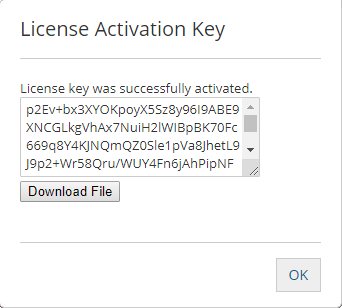
d.Click Activate. The License Activation Key dialog opens.
e.Copy the encrypted activation key to memory by selecting the activation key and using Ctrl-C
or
Click Download File which will download the LicenseActivationResponse.dat file to your computer. If you downloaded the file to a location that is on another computer, make sure you copy the file to the computer where you are installing the Metalogix SCM software.
f.Return to the License Information page in the SCM Administration Center.
7.Step 5: Apply Activation Response
a.Click Ctrl + V to paste the activation response if you copied the activation response to clipboard.
or
b.Click Choose File. The Windows file dialog opens.
c.Locate the activation key file that you saved if you followed step 6b and click Open. The file name opens next to the Choose File button.
d.Click Complete Activation to complete the activation process.
8.Step 6: Activation Complete
a.Click Finished to acknowledge the license activation.
b.Log out and log in again to access all the licensed features.