Chat now with support
Chat with Support

Spotlight on DB2 6.10 - User Guide

Spotlight on IBM DB2 LUW (Linux, Unix, and Windows)
New in This Release Getting started with Spotlight on IBM DB2 LUW Desktop features specific to Spotlight on IBM DB2 LUW Spotlight on IBM DB2 LUW drilldowns
About Spotlight on IBM DB2 LUW drilldowns Buffer Pool Analysis drilldown Client Application Analysis drilldown Database Analysis drilldown Database Manager Summary drilldown Diagnostic Log drilldown FCM Analysis drilldown Tablespace Analysis drilldown Top SQL drilldown Operating System drilldown Workload Management Analysis drilldown
Spotlight on IBM DB2 LUW alarms Spotlight on IBM DB2 LUW Options Tuning SQL statements in Spotlight on IBM DB2 LUW
Spotlight Basics
Spotlight Connections Monitor Spotlight Connections Alarms Charts, Grids And Home Page Components View | Options Troubleshooting
Spotlight History Spotlight on Windows
Connect to Windows Systems Background Information Home Page Alarms Drilldowns View | Options Troubleshooting
Spotlight on Unix About us Third-party contributions Copyright

Memory Panel


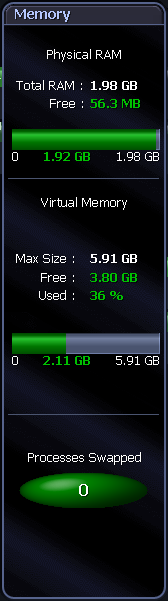
The Memory panel shows detailed information on the Windows system.:

Total RAM — Shows the amount of actual RAM (Random Access Memory) in the machine.

Free (Physical Memory) — Displays the amount of physical memory available to applications.

Free Pct (Physical Memory) — Shows the percentage of physical memory that is currently available to applications.

Physical Memory Gauge —

Physical Memory shows how much physical memory (RAM) Windows is using.

Physical Memory usage will normally remain close to the total amount of physical memory installed on the system unless the amount of physical memory you have exceeds the amount of virtual memory that Windows is using.

Windows normally keeps some physical memory available (free) for immediate reuse.


Max Size — Shows the maximum amount of virtual memory available without expanding the paging file.

Free (Virtual Memory) — Shows the current amount of virtual memory available.

Free Pct (Virtual Memory) — Shows the percentage of virtual memory that is currently available to applications.

Virtual Memory gauge — Shows the total amount of Virtual Memory available without expanding the paging file, and the current amount of Virtual Memory that is in use.


Pages found in RAM —

When a process requests a page that is not currently in its working set, the memory manager will look first in the physical memory of the system. This is called a soft page. If the memory page is not in physical memory, the page will have to be brought from disk. This is called a hard page.

This gauge shows the percentage of soft pages versus hard pages.

On a system that has a low level of activity, Pages found in RAM will be at or near 100%.

Read Hit Ratio —

Shows the percentage of disk requests that are found in cache memory.

Having requests answered from memory instead of disk cuts down on disk activity. A value of over 80% is likely to show an efficient use of system cache.

Pages Written/s —

Represents the rate at which virtual memory pages are written to disk from memory.

Virtual memory pages are written to disk when there is not enough physical memory (RAM) available for an application. This forces a dormant application to "swap" some of its used memory to the paging file (disk).

Pages Read/s —

Represents the rate at which virtual memory pages are swapped from disk into memory.

This occurs when a program that previously had part of its data or application memory "swapped" to disk requires the memory page(s) in RAM again to work on.

Disk Writes/s — Represents the rate of data being written to disk from memory. There is one Disk Writes dataflow for every disk in the Disks panel.

Disk Reads/s — Represents the rate of data being read from disk to memory. There is one Disk Reads dataflow for every disk in the Disks panel.


Related Topics

Paging Files Panel


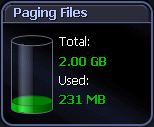
The Paging Files panel shows information on paging space for all paging files active on the system.

The disk icon "fills up" as the total percentage of all paging files used increases. This is the total amount of space used by paging files as a percentage of the maximum size of all paging files.

The disk icon also shows:

  • The total size (MB) of all paging files on all disks in the system.
  • The current amount of space (MB) being used by all paging files on all disks in the system.

Note: This does not include any potential growth of the paging files.


Related Topics

Disks Panel


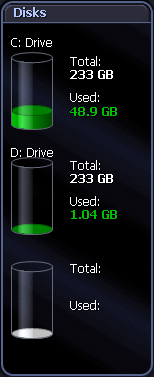
The Disks panel shows information for each logical disk on the system.:

  • The drive letter.
  • The size of the disk (MB).
  • The space used on the disk (MB).

The containers in the Disks panel represent the logical disks in the monitored system. The disk container fills up as the total percentage of used space increases.

Note: You can control the contents and appearance of the Disk panel. Windows Disks Metrics


Related Topics

Files Panel


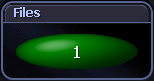
The Files panel shows the number of files whose file size is currently being tracked by Spotlight on Windows.

Note: This panel is hidden while no files are being tracked. To add / remove files, right click on the Files panel and select Files Options. Windows Files Metrics


Related Topics

Related Documents

The document was helpful.

Select Rating

I easily found the information I needed.

Select Rating