
-
Título
Using the MongoDB servers, Replica Sets, and MongoDB Clusters dashboards -
Descrição
What do the MongoDB servers, Replica Sets, and MongoDB Clusters dashboards represent? -
Resolução
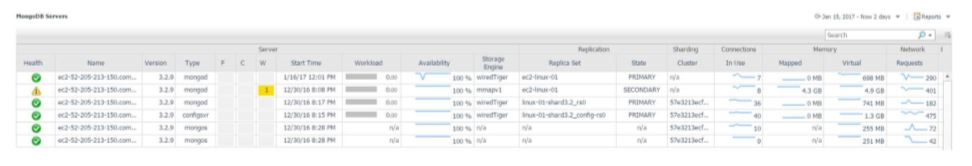
MongoDB Servers
This top-level dashboard lists all monitored MongoDB Servers and contains important configuration information, alarm status, and key metrics for the server. The workload metric is used for comparing the amount of work a server is doing relative to another MongoDB server. Clicking the DB server’s name will drill down into the Server Overview dashboard. If using the Infrastructure cartridge to monitor the host, clicking or hovering on the host name will provide more information on the DB server’s host.
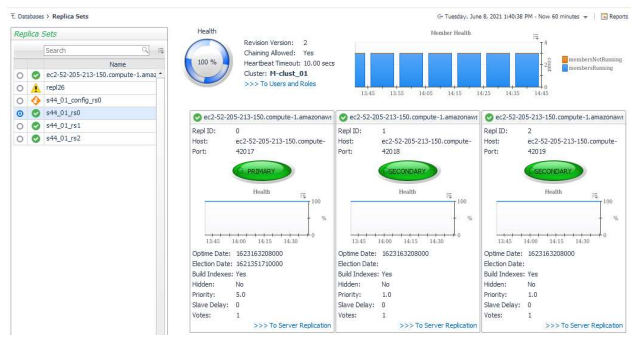
Replica Sets
This top-level dashboard is dynamic and expands to provide a list of discovered Replica Sets. Selecting a specific Replica Set from the left-hand navigation pane automatically updates the right side of the page showing all members of the Replica Set. The Health indicator shows percentage of members currently running. The adjacent bar graph shows number of members running/not running. If the server is actively monitored by a MongoDB Agent, a link “Click for More Information” will appear, leading to the Replication page for that server, covered later in this document.
MongoDB Clusters
This top-level dashboard lists all monitored MongoDB clusters. Selecting a cluster updates the page with summary data on the cluster status as well as listing the different components in the cluster, including mongos, configsvr, shards, and databases and collections.
