지금 지원 담당자와 채팅
지원 담당자와 채팅

Toad Edge 2.3 - User Guide

Outline View

The contents of the View change depending on what are you doing in Toad Edge. Its functionality can be divided into several modes:

TIP: In all modes except for Schema Compare, you can click on any item in the Outline to navigate to the object quickly in the other UI element. For example, clicking on a specific constraint in database object outline mode switches Object Detail/Describe Object to Constraints tab and highlights the selected constraint.
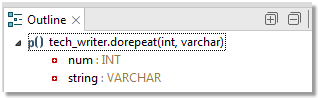
Code outline

When editing procedures, functions, etc., Outline displays the code structure, including variables.

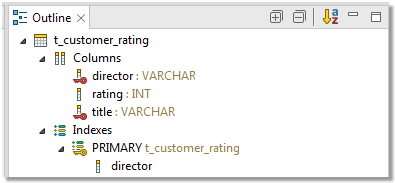
Database object outline

In this mode, Outline displays important details of database objects displayed in Object Detail and Describe Object.
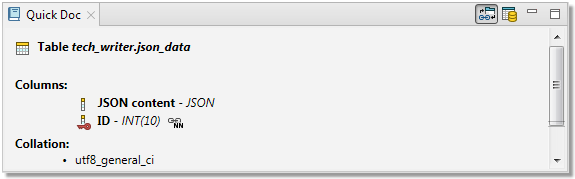
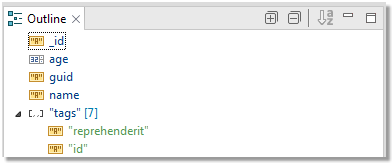
JSON outline

This mode is triggered by opening a JSON column value in JSON support and JSON Editor. In this case, the complete structure of the current JSON value, including nested values, is shown.

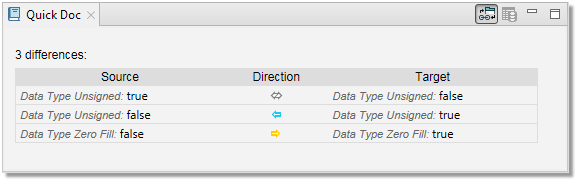
Schema Compare settings

When in Schema Compare, Outline displays comparison settings which determine what is considered a difference and what should be ignored.

Column Matching

You can match columns based on:

  • Position
  • Identical names
  • Similar names

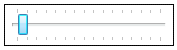
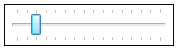
Difference Fragmentation

This slider further determines the precision of difference finding. The further it goes left, the smaller and more precise the differences are, such as specific values or words. The further it goes right, the looser and more flexible the differences are, such as entire statements or blocks of code.

Slider position Difference precision

Quick Doc View

Quick Doc displays brief, relevant information about the currently selected objects.

Quick Doc has two modes:

  • Object Explorer mode
  • Comparison mode
Object Explorer mode

This mode is used most of the time. As you select various objects in Object Explorer, Quick Doc displays basic information about them.

Comparison mode

This mode is triggered when you work with Overview Grid as part of About Schema Compare or Repository. It displays specific differences between two objects in a row that is currently selected in the grid. The view becomes very useful in cases where there are many differences.

Quick Doc view toolbar
Button Option Description
Link with Selection If enabled, Quick Doc automatically displays information every time you select an object in Object Explorer or a record in the Overview Grid
Open Declaration (Object Explorer mode only) Opens the currently described object in Object Detail and Describe Object

Run Routines

The results of all executed routines (procedures and functions) are shown in this view. You can rerun routines using the same arguments or view past results.

Button Option Description
Run Runs the routine using the argument values entered in the grid
Select Connection If you executed a routine with the same name from multiple connections, you can specify the connection from which the routine should be executed using this drop down menu
Show Results Displays the results of routines you executed in the past
Remove Execution Result Removes the current routine result from the view

SQL Monitor View

SQL Monitor displays all internal/user executed SQL queries as well as their execution time. Any queries that fail during the execution are commented out in the monitor and the error description is attached.

Button Option Description
Enable/Disable Output Enables/disables SQL query monitoring
Clear Console Deletes the contents of the view
Export Script Exports the contents of the view to a SQL file
Scroll Lock If enabled, your current position in the monitor is not changed even as new information is being displayed. Otherwise, the position changes to display the newest information
View Menu This menu allows you to enable/disable monitoring of internal/user queries
관련 문서

The document was helpful.

평가 결과 선택

I easily found the information I needed.

평가 결과 선택