Analyzing Site Collection Activity
The Site Collection Activity Analysis provides activity statistics for selected site collections, including:
·the distribution of activity among Web applications andsite collections selected for analysis, and
·the number of top site collections (that is, site collections within the scope of your analysis with the most activity).
Site Collection Activity analyses use cached data collected by ControlPoint Discovery. .
1Choose Activity > Site Collection Activity Analysis.
2Specify the parameters for your analysis.
Note that, in addition to the "standard" parameters:
§A Number of Top Sites to show in Graph must be specified. The value in this field (which is 10 by default, but may be changed) represents the number of site collections with the most activity that you want to examine more closely. These sites are listed in a separate section at the bottom of the analysis Results section.

NOTE: If you want to perform an analysis that focuses exclusively on top site collections that meet specific activity or storage criteria, you can generate a Most/Least Activity Analysis.
Now you can:
·run the operation immediately (by clicking the [Run Now] button)
OR
·schedule the operation to run at a later time or on a recurring basis.
OR
·save the operation as XML Instructions that can be run at a later time.
The Activity Report displays the following sections:
§Web Applications
§Activity Distribution
§Top Site Collections
Web Applications Section
The Web Applications section lists all of the Web applications within the scope of your analysis, along with the following statistics for individual Web applications, as well as cumulative totals:
§the number of Collections, Sites, and Lists in each Web application
NOTE: The number of Lists includes both user-created (visible) lists and internal (hidden) lists, such as galleries, that are necessary for the functioning of the site. for the specified day or time period.
Most statistics are hyperlinked to relevant SharePoint pages for Usage (for a MOSS or 2010 Foundation farm) or Web Analytics (for a SharePoint 2010 Server farm).
When expanded, statistics for individual site collections within each Web application displays, including:
·the site collection name (with a hyperlink for generating a ControlPoint Site Activity analysis for the selected site collection/time period.)and url
·the number of Sites and Lists within the collection
· the Avg. Unique Users/Day who have visited the site collection for the specified day or time period (That is, any user who has more than one set of permissions to a site is only counted once.)
·the number of Requests that the site collection has received for the specified day or time period.
·the date when the site collection was Last Accessed (within the date range specified by the analysis).
Some statistics are hyperlinked to relevant SharePoint pages for Usage (for SharePoint 2013 and later) or Web Analytics (for a SharePoint 2010 Server farm).
Activity Distribution Section
The Activity Distribution section consists of a pie chart that depicts the distribution of activity among the Web applications returned by your analysis.
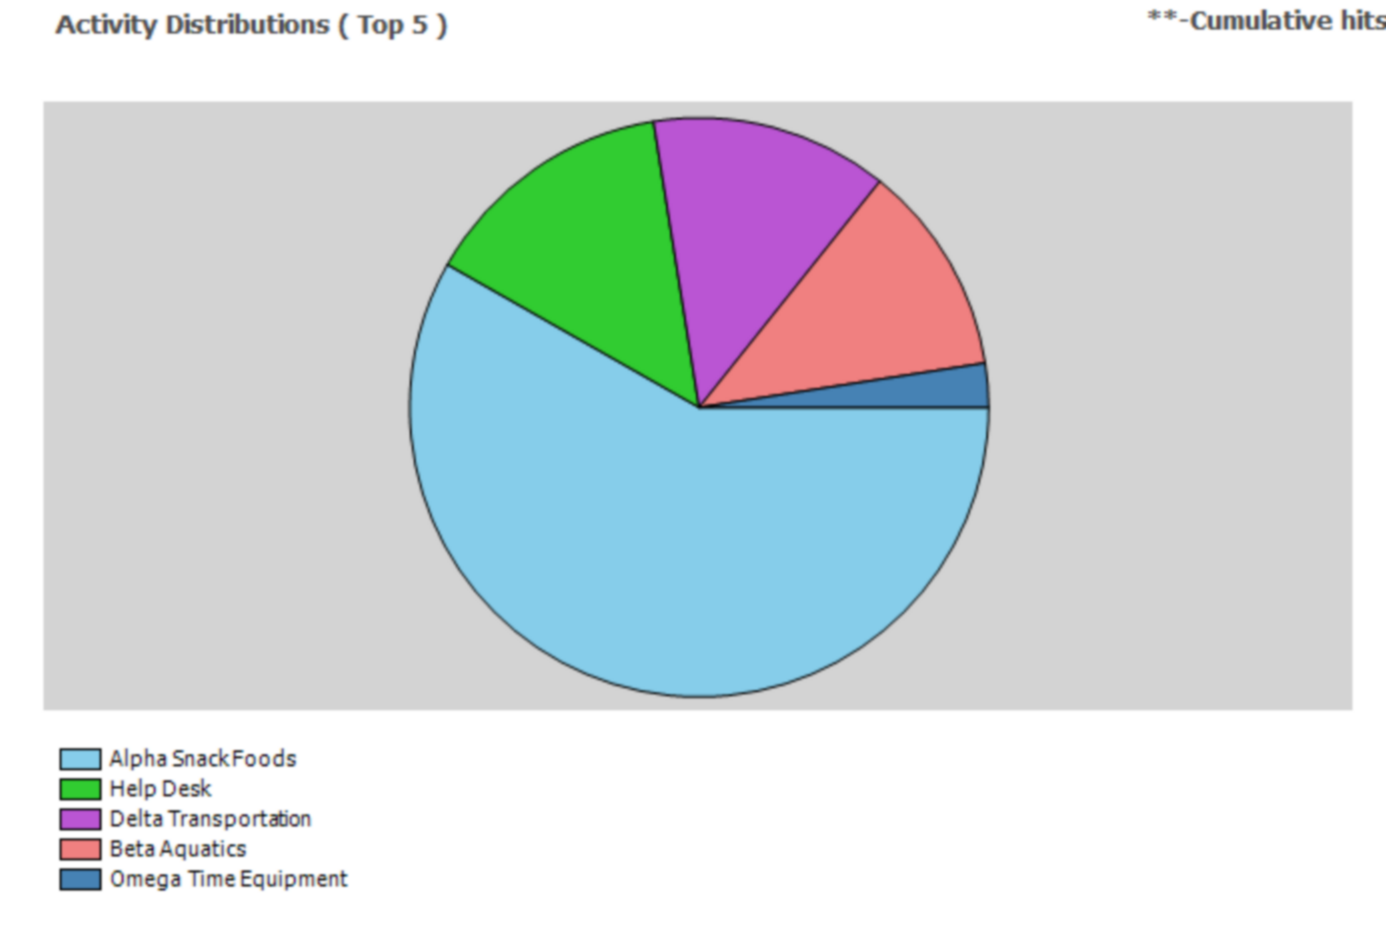
NOTE: If the analysis was generated for a single Web application, the pie chart will show the distribution of activity among site collections within that Web application.
Top Site Collections Section
This section shows statistics for the site collections within the scope of your analysis with the most activity. The number of site collections that displays in this section is determined by the value you entered in the Parameters section for Limit Display to.
NOTE: The Last Accessed date shows the last time the site collection was accessed within the date range covered by the analysis. Any activity that occurred before or after the specified date range will not be reflected in results.
Note that any site collections that have been deleted since ControlPoint Discovery began collecting data will display at the top of results, along with the word "Deleted."

See also Analyzing Most/Least Activity.
Analyzing Site Activity
The Site Activity Analysis provides activity statistics for one or more selected sites, including the distribution of activity among sites within the scope of your analysis. You can report daily activity, which uses data from the SharePoint Usage database, and for SharePoint 2013 and later, you can report monthly activity.
To generate a Site Activity Analysis:
1Select the object(s) for which you want to analyze site activity.
2Choose Activity > Site Activity Analysis.
3Select either Show Daily Activity or Show Cumulative Monthly Activity.

4Specify additional parameters for your analysis.
Note that, in addition to the "standard" parameters, Number of Top Sites to show in Graph must be specified. The value in this field (which is 10 by default, but may be changed) represents the number of pages with the most activity that you want to compare graphically (in the form of a pie chart).
The Site Activity Analysis displays the following sections:
·site collections and sites
·Activity Distribution
Site Collections and Sites Section
The site collections and sites section lists the sites within the scope of your analysis, along with the following statistics for the specified day or time period:
·each site and subsite within the scope of your selection
·the site URL
·the Avg. Unique Users/Day
·total Requests (for daily activity) or cumulative Hits (for monthly activity)
·the date or month when the site was Last Accessed.
NOTE: For Daily activity, the Last Accessed date shows the last day the site was accessed within the date range covered by the analysis. For Monthly activity, the Last Accessed date shows the last month the site was accessedas far back as the earliest month in the SharePoint Search Services databaseregardless of the date range covered by the analysis.
Note that the indentation of each site and subsite within a site collection reflect the appropriate hierarchical level.
Activity Distribution Section
The Activity Distribution section consists of a pie chart that depicts the distribution of activity among sites within the scope of your analysis.
NOTE: If the analysis encompasses only one site, the pie chart will appear solid.
Analyzing Activity by User
The Activity by User analysis lets you examine SharePoint pages and documents requested by one or more users.
You can analyze activity over the past 30 days.
You can analyze activity beyond 30 days for SharePoint 2010 Server farms, as long as the Web Analytics Service is used by the Web Application.
You can also use this analysis to identify only files that are currently checked out.
Note About "Common" File Names
Lists of "common file names" and "common file extensions" are maintained in XML file ActivityByUserOrDoc_ExcludedFileNames_2010.xml located on the Web front-end server where ControlPoint is installed, in the following SharePoint hive subdirectory: \TEMPLATE\LAYOUTS\Axceler\App_Data.
The purpose of this list is to give you the option of either including or excluding frequently used files from analysis results. You can customize the XML files to include file names specific to your environment. For example, you may want to filter out image files used on many pages that do not reflect actual patterns of user activity. You can also remove any of the default file names provided by Metalogix.
NOTE: Names in this file will populate the Exclude File Names parameter. By default, this file includes SharePoint internal files. When you specify the parameters for your analysis, you can exclude some or all of the file names in this list.
IMPORTANT: Changes that you make to these files must be copied to any additional Web front-end servers in your farm. Also, whenever you install a ControlPoint update or patch, these files are overwritten with files containing the default lists. Therefore, if you choose to make modifications, it is recommended that you keep a backup of the file in a different location so that you can replace the default version after an update or patch.
To generate an Activity by User analysis:
1Select the object(s) on which you want to perform the analysis.
2Choose Activity > Activity by User.
3Specify the parameters for your analysis.
In addition to "standard" parameters (and the ability to exclude files, as described above), you can choose to have analysis results display information about Checked-out documents only. Results will include documents that were checked out between the specified start and end date, but have not been checked back in as of the analysis run date. If you select this option and also check Include Documents with no checked-in version, only documents that have never been checked in (which may happen, for example, if a document was uploaded but a value was not provided for a required property).
NOTE: If you accept the default (All Activity), the Include Documents with no checked-in version checkbox will always be ignored.
Now you can:
·run the operation immediately (by clicking the [Run Now] button)
OR
·schedule the operation to run at a later time or on a recurring basis.
OR
·save the operation as XML Instructions that can be run at a later time.
|
If you chose to analyze... |
Then ... |
|---|---|
|
All Activity |
The top level of the analysis displays the following information for each user: ·username (login name) and Display Name ·for each Web application: the cumulative number of Page Views for all selected site collections within the Web application (as determined by the scope of your selection) ·for each site collection: the cumulative number of user Requests/Page Views for all of the sites within the site collection ·for each site: the total number of user Requests/page views for pages and documents within the site, and ·the total number of requests/page views made by the user. When a site is expanded, a list of all of the documents and pages that the user requested/viewed displays, along with the following information: ·the relative url for each page or document, and ·the number of requests by the user for each page or document. Note that, if the analysis was run on a SharePoint 2010 Server farm beyond the past 30 days, individual file detail cannot be reported and file exclusions cannot be applied. |
|
Checked-out documents only |
Analysis results display the following information for each checked out document: ·the Document Name (with a link to the ControlPoint Audit Log analysis or the specified date range) NOTE: If SharePoint auditing is not enabled for the check in/check out event, the Audit Log analysis will show No Results to Display. ·the URL to the document within the library ·the date and time that the document has been Checked Out Since ·the Last Modified Time If you chose to Include Documents with no checked-in version, documents that meet that criteria (if any) will also be included in analysis results, identified by the symbols ##. |
Analyzing Activity by Document
The Activity by Document analysis lets you examine request detail for each document or page within a selected scope.
You can analyze activity for all SharePoint farms over the past 30 days.
You can analyze activity beyond 30 days for SharePoint 2010 Server farms, as long as the Web Analytics Service is used by the Web Application.
You can also use this analysis to identify only files that are currently checked out. (If you want to identify all currently-checked out documents, regardless of date range, use the Checked Out Documents analysis.)
Note About "Common" File Names
Lists of "common file names" and "common file extensions" are maintained in XML file ActivityByUserOrDoc_ExcludedFileNames_2010.xml located on the Web front-end server where ControlPoint is installed, in the following SharePoint hive subdirectory: \TEMPLATE\LAYOUTS\Axceler\App_Data.
The purpose of this list is to give you the option of either including or excluding frequently used files from analysis results. You can customize the XML files to include file names specific to your environment. For example, you may want to filter out image files used on many pages that do not reflect actual patterns of user activity. You can also remove any of the default file names provided by Metalogix.
NOTE: Names in this file will populate the Exclude File Names parameter. By default, this file includes SharePoint internal files. When you specify the parameters for your analysis, you can exclude some or all of the file names in this list.
IMPORTANT: Changes that you make to these files must be copied to any additional Web front-end servers in your farm. Also, whenever you install a ControlPoint update or patch, these files are overwritten with files containing the default lists. Therefore, if you choose to make modifications, it is recommended that you keep a backup of the file in a different location so that you can replace the default version after an update or patch.
To generate an Activity by Document analysis:
1Select the object(s) on which you want to perform the analysis.
2Choose Activity > Activity by Document.
3Specify the parameters for your analysis.
In addition to "standard" parameters (and the ability to exclude files, as described above), you can choose to have analysis results display information about Checked-out documents only. Results will include documents that were checked out between the specified start and end date, but have not been checked back in as of the analysis run date. If you select this option and also check Include Documents with no checked-in version, documents for which no checked version exists (which may happen, for example, if a document was uploaded but a value was not provided for a required property) will also be included and will be flagged.
NOTE: If you accept the default (All Activity), the Include Documents with no checked-in version checkbox will always be ignored.
Now you can:
·run the operation immediately (by clicking the [Run Now] button)
OR
·schedule the operation to run at a later time or on a recurring basis.
OR
·save the operation as XML Instructions that can be run at a later time.
|
If you chose to analyze... |
Then ... |
|---|---|
|
All Activity |
The top level of the analysis displays the following information: ·for each Web application: the cumulative number of Page Views within the Web application (as determined by the scope of your selection) ·for each site collection: the cumulative number of document or page Requests/Page Views for all of the sites within the site collection, and ·for each site: the total number of document or page Requests/Page Views within the site. ·for each document or page which has had activity: the total Requests/Page Views for that document or page. When a site is expanded, the following information displays for each document/page: ·the relative url for the page or Document ·the Username (login name) and Display Name of each user who requested/viewed the document or page, and ·the number of Requests/Page Views for each document or page. Note that, if the analysis was run on a SharePoint 2010 Server farm beyond the past 30 days, individual file detail cannot be reported and file exclusions cannot be applied. |
|
Checked-out documents only |
Analysis results display the following information for each checked out document: othe Document Name (with a link to the ControlPoint Audit Log analysis for the specified date range) NOTE: If SharePoint auditing is not enabled for the check in/check out event, the Audit Log analysis will show No Results to Display. ·the URL to the document within the library ·the date and time that the document has been Checked Out Since ·the Last Modified Time If you chose to Include documents that have never been checked out, documents that meet that criteria (if any) will also be included in analysis results, flagged by the symbols ###. |